
Page 579 - Provincial Treasury Estimates.pdf
P. 579
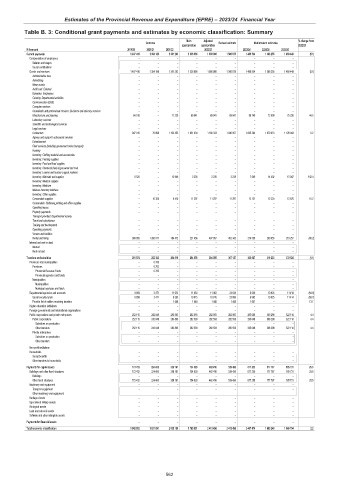
Estimates of the Provincial Revenue and Expenditure (EPRE) – 2023/24 Financial Year
Table B. 3: Conditional grant payments and estimates by economic classification: Summary
Main Adjusted % change from
Outcome Revised estimate Medium-term estimates
appropriation appropriation 2022/23
R thousand 2019/20 2020/21 2021/22 2022/23 2023/24 2024/25 2025/26
Current payments 1 407 416 1 354 189 1 381 203 1 336 966 1 656 966 1 566 875 1 486 534 1 388 255 1 450 449 (5.1)
Compensation of employees – – – – – – – – –
Salaries and wages – – – – – – – – –
Social contributions – – – – – – – – –
Goods and services 1 407 416 1 354 189 1 381 203 1 336 966 1 656 966 1 566 875 1 486 534 1 388 255 1 450 449 (5.1)
Administrative fees – – – – – – – – –
Advertising – – – – – – – – –
Minor assets – – – – – – – – –
Audit cost: External – – – – – – – – –
Bursaries: Employees – – – – – – – – –
Catering: Departmental activities – – – – – – – – –
Communication (G&S) – – – – – – – – –
Computer services – – – – – – – – –
Consultants and professional services: Business and advisory services – – – – – – – – –
Infrastructure and planning 64 518 – 71 220 69 041 69 041 69 041 99 740 72 000 75 226 44.5
Laboratory services – – – – – – – – –
Scientific and technological services – – – – – – – – –
Legal services – – – – – – – – –
Contractors 947 415 76 898 1 103 455 1 031 934 1 166 333 1 030 957 1 095 264 1 079 674 1 128 043 6.2
Agency and support / outsourced services – – – – – – – – –
Entertainment – – – – – – – – –
Fleet services (including government motor transport) – – – – – – – – –
Housing – – – – – – – – –
Inventory: Clothing material and accessories – – – – – – – – –
Inventory: Farming supplies – – – – – – – – –
Inventory: Food and food supplies – – – – – – – – –
Inventory: Chemicals,fuel,oil,gas,wood and coal – – – – – – – – –
Inventory: Learner and teacher support material – – – – – – – – –
Inventory: Materials and supplies 5 528 – 12 646 3 238 3 238 3 238 7 849 14 402 15 047 142.4
Inventory: Medical supplies – – – – – – – – –
Inventory: Medicine – – – – – – – – –
Medsas inventory interface – – – – – – – – –
Inventory: Other supplies – – – – – – – – –
Consumable supplies – 10 320 9 410 11 297 11 297 11 297 13 131 12 324 12 876 16.2
Consumable: Stationery,printing and office supplies – – – – – – – – –
Operating leases – – – – – – – – –
Property payments – – – – – – – – –
Transport provided: Departmental activity – – – – – – – – –
Travel and subsistence – – – – – – – – –
Training and development – – – – – – – – –
Operating payments – – – – – – – – –
Venues and facilities – – – – – – – – –
Rental and hiring 389 955 1 266 971 184 472 221 456 407 057 452 342 270 550 209 855 219 257 (40.2)
Interest and rent on land – – – – – – – – –
Interest – – – – – – – – –
Rent on land – – – – – – – – –
Transfers and subsidies 261 974 252 302 294 816 294 056 294 056 307 127 303 687 319 223 333 524 (1.1)
Provinces and municipalities – 6 783 – – – – – – –
Provinces – 6 783 – – – – – – –
Provincial Revenue Funds – 6 783 – – – – – – –
Provincial agencies and funds – – – – – – – – –
Municipalities – – – – – – – – –
Municipalities – – – – – – – – –
Municipal agencies and funds – – – – – – – – –
Departmental agencies and accounts 9 859 3 471 11 013 11 463 11 463 24 534 8 639 10 925 11 414 (64.8)
Social security funds 9 859 3 471 9 565 10 015 10 015 23 086 6 992 10 925 11 414 (69.7)
Provide list of entities receiving transfers – – 1 448 1 448 1 448 1 448 1 647 – – 13.7
Higher education institutions – – – – – – – – –
Foreign governments and international organisations – – – – – – – – –
Public corporations and private enterprises 252 115 242 048 283 803 282 593 282 593 282 593 295 048 308 298 322 110 4.4
Public corporations 252 115 242 048 283 803 282 593 282 593 282 593 295 048 308 298 322 110 4.4
Subsidies on production – – – – – – – – –
Other transfers 252 115 242 048 283 803 282 593 282 593 282 593 295 048 308 298 322 110 4.4
Private enterprises – – – – – – – – –
Subsidies on production – – – – – – – – –
Other transfers – – – – – – – – –
Non-profit institutions
Households – – – – – – – – –
Social benefits – – – – – – – – –
Other transfers to households – – – – – – – – –
Payments for capital assets 173 412 224 600 359 161 154 529 462 416 539 436 677 255 177 767 185 731 25.5
Buildings and other fixed structures 173 412 224 600 359 161 154 529 462 416 539 436 677 255 177 767 185 731 25.5
Buildings – – – – – – – – –
Other fixed structures 173 412 224 600 359 161 154 529 462 416 539 436 677 255 177 767 185 731 25.5
Machinery and equipment – – – – – – – – –
Transport equipment – – – – – – – – –
Other machinery and equipment – – – – – – – – –
Heritage Assets – – – – – – – – –
Specialised military assets – – – – – – – – –
Biological assets – – – – – – – – –
Land and sub-soil assets – – – – – – – – –
Software and other intangible assets – – – – – – – – –
Payments for financial assets – – – – – – – – –
Total economic classification 1 842 802 1 831 091 2 035 180 1 785 551 2 413 438 2 413 438 2 467 476 1 885 245 1 969 704 2.2
562