
Page 577 - Provincial Treasury Estimates.pdf
P. 577
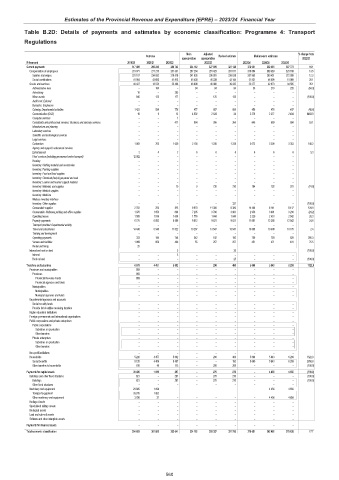
Estimates of the Provincial Revenue and Expenditure (EPRE) – 2023/24 Financial Year
Table B.2D: Details of payments and estimates by economic classification: Programme 4: Transport
Regulations
Main Adjusted % change from
Outcome Revised estimate Medium-term estimates
appropriation appropriation 2022/23
R thousand 2019/20 2020/21 2021/22 2022/23 2023/24 2024/25 2025/26
Current payments 317 498 296 249 286 742 334 162 327 909 321 128 372 961 352 003 367 773 16.1
Compensation of employees 273 071 277 275 261 331 287 264 281 429 281 671 319 684 309 330 323 188 13.5
Salaries and wages 231 107 234 592 219 518 241 826 236 091 238 528 267 853 260 431 272 099 12.3
Social contributions 41 964 42 683 41 813 45 438 45 338 43 144 51 831 48 899 51 089 20.1
Goods and services 44 427 18 974 25 406 46 898 46 480 39 432 53 277 42 673 44 585 35.1
Administrative fees – 104 – 84 84 84 30 219 228 (64.3)
Advertising 10 – 295 – – – – – –
Minor assets 846 125 177 – 125 125 – – – (100.0)
Audit cost: External – – – – – – – – –
Bursaries: Employees – – – – – – – – –
Catering: Departmental activities 1 433 534 776 477 887 888 456 476 497 (48.6)
Communication (G&S) 16 6 12 4 002 2 524 24 2 276 2 377 2 484 9463.0
Computer services – – 1 – – – – – –
Consultants and professional services: Business and advisory services – – 417 864 356 356 545 569 594 53.1
Infrastructure and planning – – – – – – – – –
Laboratory services – – – – – – – – –
Scientific and technological services – – – – – – – – –
Legal services – – – – – – – – –
Contractors 1 063 703 1 629 2 138 1 238 1 238 3 072 3 209 3 353 148.2
Agency and support / outsourced services – – – – – – – – –
Entertainment 2 4 2 6 6 6 6 6 6 5.3
Fleet services (including government motor transport) 12 082 – – – – – – – –
Housing – – – – – – – – –
Inventory: Clothing material and accessories – – – – – – – – –
Inventory: Farming supplies – – – – – – – – –
Inventory: Food and food supplies – – – – – – – – –
Inventory: Chemicals,fuel,oil,gas,wood and coal – – – – – – – – –
Inventory: Learner and teacher support material – – – – – – – – –
Inventory: Materials and supplies – – 10 0 730 730 184 192 201 (74.8)
Inventory: Medical supplies – – – – – – – – –
Inventory: Medicine – – – – – – – – –
Medsas inventory interface – – – – – – – – –
Inventory: Other supplies – – – – – 337 – – – (100.0)
Consumable supplies 2 782 250 515 9 970 11 380 6 380 14 480 6 141 6 417 126.9
Consumable: Stationery,printing and office supplies 1 970 1 850 644 7 205 3 790 3 903 2 959 3 091 3 230 (24.2)
Operating leases 1 585 1 516 1 634 1 776 1 844 1 844 2 329 2 433 2 542 26.3
Property payments 6 775 6 883 6 466 9 812 9 521 9 521 11 861 12 388 12 943 24.6
Transport provided: Departmental activity – – – – – – – – –
Travel and subsistence 14 436 5 946 11 622 10 267 13 547 13 547 13 869 10 308 10 770 2.4
Training and development – – – – – – – – –
Operating payments 333 194 746 242 192 192 759 793 829 295.3
Venues and facilities 1 069 859 460 55 257 257 451 471 491 75.5
Rental and hiring 25 – – – – – – – –
Interest and rent on land – – 5 – – 25 – – – (100.0)
Interest – – 5 – – – – – –
Rent on land – – – – – 25 – – – (100.0)
Transfers and subsidies 6 079 4 457 5 602 – 208 400 5 690 5 943 6 209 1322.9
Provinces and municipalities 859 – – – – – – – –
Provinces 859 – – – – – – – –
Provincial Revenue Funds 859 – – – – – – – –
Provincial agencies and funds – – – – – – – – –
Municipalities – – – – – – – – –
Municipalities – – – – – – – – –
Municipal agencies and funds – – – – – – – – –
Departmental agencies and accounts – – – – – – – – –
Social security funds – – – – – – – – –
Provide list of entities receiving transfers – – – – – – – – –
Higher education institutions – – – – – – – – –
Foreign governments and international organisations – – – – – – – – –
Public corporations and private enterprises – – – – – – – – –
Public corporations – – – – – – – – –
Subsidies on production – – – – – – – – –
Other transfers – – – – – – – – –
Private enterprises – – – – – – – – –
Subsidies on production – – – – – – – – –
Other transfers – – – – – – – – –
Non-profit institutions – – – – – – – – –
Households 5 220 4 457 5 602 – 208 400 5 690 5 943 6 209 1322.9
Social benefits 5 120 4 409 5 487 – – 192 5 690 5 943 6 209 2858.9
Other transfers to households 100 48 115 – 208 208 – – – (100.0)
Payments for capital assets 30 426 1 099 297 – 270 270 – 4 456 4 656 (100.0)
Buildings and other fixed structures 621 – 297 – 270 270 – – – (100.0)
Buildings 621 – 297 – 270 270 – – – (100.0)
Other fixed structures – – – – – – – – –
Machinery and equipment 29 805 1 099 – – – – – 4 456 4 656
Transport equipment 26 015 1 062 – – – – – – –
Other machinery and equipment 3 790 37 – – – – – 4 456 4 656
Heritage Assets – – – – – – – – –
Specialised military assets – – – – – – – – –
Biological assets – – – – – – – – –
Land and sub-soil assets – – – – – – – – –
Software and other intangible assets – – – – – – – – –
Payments for financial assets – – – – – – – – –
Total economic classification 354 003 301 805 292 641 334 162 328 387 321 798 378 651 362 402 378 638 17.7
560