
Page 214 - Demo
P. 214
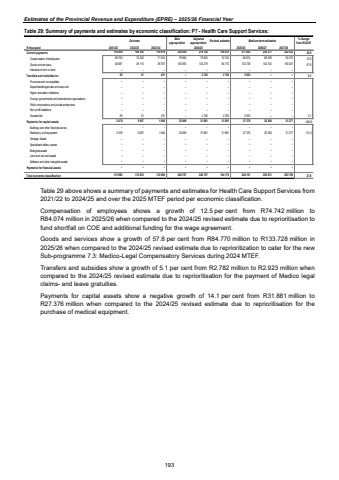
Estimates of the Provincial Revenue and Expenditure (EPRE) %u2013 2025/26 Financial YearTable 29: Summary of payments and estimates by economic classification: P7 - Health Care Support Services:Outcome Main appropriationAdjusted appropriation Revised estimate Medium-term estimates % change from 2024/25R thousand 2021/22 2022/23 2023/24 2025/26 2026/27 2027/28Current payments 109 355 110 469 110 619 224 938 214 124 159 512 217 802 230 271 242 522 36.5Compensation of employees 70 240 69 782 71 912 79 845 79 845 74 742 84 074 86 529 92 275 12.5Goods and services 40 687 39 115 38 707 145 093 134 279 84 770 133 728 143 742 150 247 57.8Interest and rent on land %u2013 %u2013 %u2013 %u2013 %u2013 %u2013 %u2013 %u2013 %u2013Transfers and subsidies to: 39 31 431 %u2013 2 782 2 782 2 923 %u2013 %u2013 5.1Provinces and municipalities %u2013 %u2013 %u2013 %u2013 %u2013 %u2013 %u2013 %u2013 %u2013Departmental agencies and accounts %u2013 %u2013 %u2013 %u2013 %u2013 %u2013 %u2013 %u2013 %u2013Higher education institutions %u2013 %u2013 %u2013 %u2013 %u2013 %u2013 %u2013 %u2013 %u2013Foreign governments and international organisations %u2013 %u2013 %u2013 %u2013 %u2013 %u2013 %u2013 %u2013 %u2013Public corporations and private enterprises %u2013 %u2013 %u2013 %u2013 %u2013 %u2013 %u2013 %u2013 %u2013Non-profit institutions %u2013 %u2013 %u2013 %u2013 %u2013 %u2013 %u2013 %u2013 %u2013Households 39 31 431 %u2013 2 782 2 782 2 923 %u2013 %u2013 5.1Payments for capital assets 2 478 5 667 1 646 23 849 31 881 31 881 27 376 20 360 21 277 (14.1)Buildings and other fixed structures %u2013 %u2013 %u2013 %u2013 %u2013 %u2013 %u2013 %u2013 %u2013Machinery and equipment 2 478 5 667 1 646 23 849 31 881 31 881 27 376 20 360 21 277 (14.1)Heritage Assets %u2013 %u2013 %u2013 %u2013 %u2013 %u2013 %u2013 %u2013 %u2013Specialised military assets %u2013 %u2013 %u2013 %u2013 %u2013 %u2013 %u2013 %u2013 %u2013Biological assets %u2013 %u2013 %u2013 %u2013 %u2013 %u2013 %u2013 %u2013 %u2013Land and sub-soil assets %u2013 %u2013 %u2013 %u2013 %u2013 %u2013 %u2013 %u2013 %u2013Software and other intangible assets %u2013 %u2013 %u2013 %u2013 %u2013 %u2013 %u2013 %u2013 %u2013Payments for financial assets %u2013 %u2013 %u2013 %u2013 %u2013 %u2013 %u2013 %u2013 %u2013Total economic classification 112 986 115 053 112 696 248 787 248 787 194 175 248 101 250 631 263 799 27.82024/25Table 29 above shows a summary of payments and estimates for Health Care Support Services from 2021/22 to 2024/25 and over the 2025 MTEF period per economic classification. Compensation of employees shows a growth of 12.5 per cent from R74.742 million to R84.074 million in 2025/26 when compared to the 2024/25 revised estimate due to reprioritisation to fund shortfall on COE and additional funding for the wage agreement. Goods and services show a growth of 57.8 per cent from R84.770 million to R133.728 million in 2025/26 when compared to the 2024/25 revised estimate due to reprioritization to cater for the new Sub-programme 7.3: Medico-Legal Compensatory Services during 2024 MTEF. Transfers and subsidies show a growth of 5.1 per cent from R2.782 million to R2.923 million when compared to the 2024/25 revised estimate due to reprioritisation for the payment of Medico legal claims- and leave gratuities. Payments for capital assets show a negative growth of 14.1 per cent from R31.881 million to R27.376 million when compared to the 2024/25 revised estimate due to reprioritisation for the purchase of medical equipment. 193
