
Page 212 - Demo
P. 212
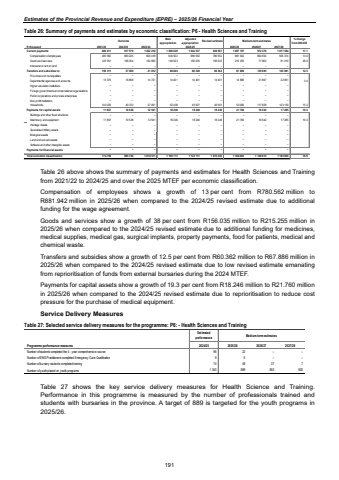
Estimates of the Provincial Revenue and Expenditure (EPRE) %u2013 2025/26 Financial YearTable 26: Summary of payments and estimates by economic classification: P6 - Health Sciences and Training Outcome Main appropriationAdjusted appropriation Revised estimate Medium-term estimates % change from 2024/25R thousand 2021/22 2022/23 2023/24 2025/26 2026/27 2027/28Current payments 606 611 917 579 1 022 218 1 080 025 1 044 537 936 597 1 097 197 972 376 1 017 584 17.1Compensation of employees 483 560 809 225 829 418 930 502 888 502 780 562 881 942 894 694 936 374 13.0Goods and services 123 051 108 354 192 800 149 523 156 035 156 035 215 255 77 682 81 210 38.0Interest and rent on land %u2013 %u2013 %u2013 %u2013 %u2013 %u2013 %u2013 %u2013 %u2013Transfers and subsidies to: 156 311 57 589 41 812 66 840 60 328 60 362 67 886 139 695 145 981 12.5Provinces and municipalities %u2013 %u2013 %u2013 %u2013 %u2013 %u2013 %u2013 %u2013 %u2013Departmental agencies and accounts 13 075 16 866 14 721 14 401 14 401 14 401 14 886 21 867 22 851 3.4Higher education institutions %u2013 %u2013 %u2013 %u2013 %u2013 %u2013 %u2013 %u2013 %u2013Foreign governments and international organisations %u2013 %u2013 %u2013 %u2013 %u2013 %u2013 %u2013 %u2013 %u2013Public corporations and private enterprises %u2013 %u2013 %u2013 %u2013 %u2013 %u2013 %u2013 %u2013 %u2013Non-profit institutions %u2013 %u2013 %u2013 %u2013 %u2013 %u2013 %u2013 %u2013 %u2013Households 143 236 40 723 27 091 52 439 45 927 45 961 53 000 117 828 123 130 15.3Payments for capital assets 11 837 10 538 12 541 18 246 18 246 18 246 21 760 16 542 17 285 19.3Buildings and other fixed structures %u2013 %u2013 %u2013 %u2013 %u2013 %u2013 %u2013 %u2013 %u2013Machinery and equipment 11 837 10 538 12 541 18 246 18 246 18 246 21 760 16 542 17 285 19.3Heritage Assets %u2013 %u2013 %u2013 %u2013 %u2013 %u2013 %u2013 %u2013 %u2013Specialised military assets %u2013 %u2013 %u2013 %u2013 %u2013 %u2013 %u2013 %u2013 %u2013Biological assets %u2013 %u2013 %u2013 %u2013 %u2013 %u2013 %u2013 %u2013 %u2013Land and sub-soil assets %u2013 %u2013 %u2013 %u2013 %u2013 %u2013 %u2013 %u2013 %u2013Software and other intangible assets %u2013 %u2013 %u2013 %u2013 %u2013 %u2013 %u2013 %u2013 %u2013Payments for financial assets %u2013 %u2013 %u2013 %u2013 %u2013 %u2013 %u2013 %u2013 %u2013Total economic classification 774 759 985 706 1 076 571 1 165 111 1 123 111 1 015 205 1 186 843 1 128 613 1 180 850 16.92024/25 Table 26 above shows the summary of payments and estimates for Health Sciences and Training from 2021/22 to 2024/25 and over the 2025 MTEF per economic classification. Compensation of employees shows a growth of 13 per cent from R780.562 million to R881.942 million in 2025/26 when compared to the 2024/25 revised estimate due to additional funding for the wage agreement. Goods and services show a growth of 38 per cent from R156.035 million to R215.255 million in 2025/26 when compared to the 2024/25 revised estimate due to additional funding for medicines, medical supplies, medical gas, surgical implants, property payments, food for patients, medical and chemical waste. Transfers and subsidies show a growth of 12.5 per cent from R60.362 million to R67.886 million in 2025/26 when compared to the 2024/25 revised estimate due to low revised estimate emanating from reprioritisation of funds from external bursaries during the 2024 MTEF. Payments for capital assets show a growth of 19.3 per cent from R18.246 million to R21.760 million in 2025/26 when compared to the 2024/25 revised estimate due to reprioritisation to reduce cost pressure for the purchase of medical equipment. Service Delivery Measures Table 27: Selected service delivery measures for the programme: P6: - Health Sciences and Training Estimatedperformance Medium-term estimatesProgramme performance measures 2024/25 2025/26 2026/27 2027/28Number of students completed the 4 - year comprehensive course 22 96 %u2013 %u2013 Number of EMS Practitioners completed Emergency Care Qualification 6 9 %u2013 %u2013 Number of bursary students completed training 49 74 37 7 Number of youth placed on youth programs 889 1 350 850 800 Table 27 shows the key service delivery measures for Health Science and Training. Performance in this programme is measured by the number of professionals trained and students with bursaries in the province. A target of 889 is targeted for the youth programs in 2025/26. 191
