
Page 216 - Demo
P. 216
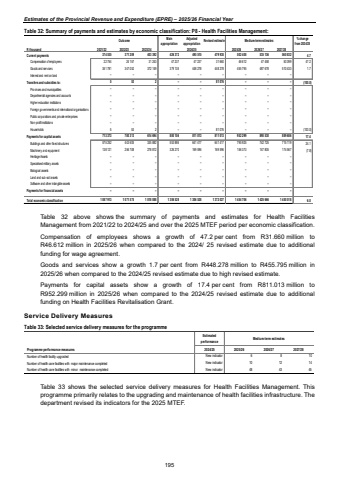
Estimates of the Provincial Revenue and Expenditure (EPRE) %u2013 2025/26 Financial YearTable 32: Summary of payments and estimates by economic classification: P8 - Health Facilities Management: Outcome Main appropriationAdjusted appropriation Revised estimate Medium-term estimates % change from 2024/25R thousand 2021/22 2022/23 2023/24 2025/26 2026/27 2027/28Current payments 371 209 374 535 403 392 426 372 495 515 479 938 502 408 535 136 560 832 4.7Compensation of employees 24 157 22 754 31 243 47 237 47 237 31 660 46 612 47 458 50 399 47.2Goods and services 347 052 351 781 372 149 379 135 448 278 448 278 455 795 487 678 510 433 1.7Interest and rent on land %u2013 %u2013 %u2013 %u2013 %u2013 %u2013 %u2013 %u2013 %u2013 Transfers and subsidies to: 53 5 2 %u2013 %u2013 81 076 %u2013 %u2013 %u2013 (100.0)Provinces and municipalities %u2013 %u2013 %u2013 %u2013 %u2013 %u2013 %u2013 %u2013 %u2013 Departmental agencies and accounts %u2013 %u2013 %u2013 %u2013 %u2013 %u2013 %u2013 %u2013 %u2013 Higher education institutions %u2013 %u2013 %u2013 %u2013 %u2013 %u2013 %u2013 %u2013 %u2013Foreign governments and international organisations %u2013 %u2013 %u2013 %u2013 %u2013 %u2013 %u2013 %u2013 %u2013Public corporations and private enterprises %u2013 %u2013 %u2013 %u2013 %u2013 %u2013 %u2013 %u2013 %u2013Non-profit institutions %u2013 %u2013 %u2013 %u2013 %u2013 %u2013 %u2013 %u2013 %u2013Households 5 53 2 %u2013 %u2013 81 076 %u2013 %u2013 %u2013 (100.0)Payments for capital assets 713 373 700 313 614 694 880 156 811 013 811 013 952 299 890 530 889 686 17.4Buildings and other fixed structures 575 252 443 605 335 882 553 886 641 417 641 417 795 925 742 725 715 119 24.1Machinery and equipment 138 121 256 708 278 812 326 270 169 596 169 596 156 373 147 805 174 567 (7.8)Heritage Assets %u2013 %u2013 %u2013 %u2013 %u2013 %u2013 %u2013 %u2013 %u2013Specialised military assets %u2013 %u2013 %u2013 %u2013 %u2013 %u2013 %u2013 %u2013 %u2013Biological assets %u2013 %u2013 %u2013 %u2013 %u2013 %u2013 %u2013 %u2013 %u2013Land and sub-soil assets %u2013 %u2013 %u2013 %u2013 %u2013 %u2013 %u2013 %u2013 %u2013Software and other intangible assets %u2013 %u2013 %u2013 %u2013 %u2013 %u2013 %u2013 %u2013 %u2013Payments for financial assets %u2013 %u2013 %u2013 %u2013 %u2013 %u2013 %u2013 %u2013 %u2013Total economic classification 1 087 913 1 071 575 1 018 088 1 306 528 1 306 528 1 372 027 1 454 706 1 425 666 1 450 518 6.02024/25 Table 32 above shows the summary of payments and estimates for Health Facilities Management from 2021/22 to 2024/25 and over the 2025 MTEF period per economic classification. Compensation of employees shows a growth of 47.2 per cent from R31.660 million to R46.612 million in 2025/26 when compared to the 2024/ 25 revised estimate due to additional funding for wage agreement. Goods and services show a growth 1.7 per cent from R448.278 million to R455.795 million in 2025/26 when compared to the 2024/25 revised estimate due to high revised estimate. Payments for capital assets show a growth of 17.4 per cent from R811.013 million to R952.299 million in 2025/26 when compared to the 2024/25 revised estimate due to additional funding on Health Facilities Revitalisation Grant. Service Delivery Measures Table 33: Selected service delivery measures for the programme Estimatedperformance Medium-term estimatesProgramme performance measures 2024/25 2025/26 2026/27 2027/28Number of health facility upgraded New indicator 6 8 10Number of health care facilities with major maintenance completed New indicator 10 12 14Number of health care facilities with minor maintenance completed New indicator 48 43 45 Table 33 shows the selected service delivery measures for Health Facilities Management. This programme primarily relates to the upgrading and maintenance of health facilities infrastructure. The department revised its indicators for the 2025 MTEF. 195
