
Page 217 - Demo
P. 217
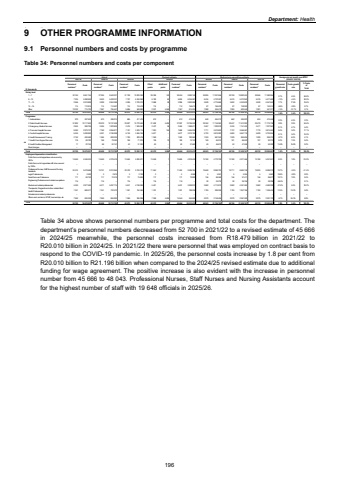
Department: Health9 OTHER PROGRAMME INFORMATION 9.1 Personnel numbers and costs by programme Table 34: Personnel numbers and costs per component Actual Revised estimate Medium-term expenditure estimateR thousandsPersonnel numbers1 Costs Personnel numbers1 Costs Personnel numbers1 Costs Filled postsAdditional postsPersonnel numbers1 Costs Personnel numbers1 Costs Personnel numbers1 Costs Personnel numbers1 Costs Personnel growth rate Costs growth rate % Costs of Total Salary level1 %u2013 7 32 163 9 651 754 27 935 9 540 221 31 759 10 023 324 28 305 149 28 454 9 982 148 30 805 11 037 656 30 759 10 892 453 30 846 11 380 954 2.7% 4.5% 50.8%8 %u2013 10 7 235 5 388 836 9 633 5 409 231 7 107 6 433 950 6 762 63 6 825 6 254 581 6 435 4 722 597 6 575 5 373 040 6 576 5 471 669 -1.2% -4.4% 26.9%11 %u2013 12 2 956 2 610 808 3 009 2 853 398 3 026 2 729 573 2 868 38 2 906 2 802 086 3 628 4 775 668 3 602 4 432 629 3 628 4 557 645 7.7% 17.6% 18.6%13 %u2013 16 114 112 814 114 114 501 114 116 419 114 %u2013 114 156 412 87 166 420 87 138 592 87 143 513 -8.6% -2.8% 0.7%Other 10 232 715 725 7 967 795 447 6 866 648 885 2 021 5 346 7 367 815 252 7 088 494 419 7 083 602 446 7 081 541 911 -1.3% -12.7% 3.1%Total 52 700 18 479 937 48 658 18 712 799 48 872 19 952 151 40 070 5 596 45 666 20 010 479 48 043 21 196 760 48 106 21 439 161 48 218 22 095 691 1.8% 3.4% 100.0%Programme1. Administration 970 397 632 673 396 013 685 411 475 612 %u2013 612 419 426 648 465 219 662 505 022 653 475 446 2.2% 4.3% 2.2%2. District Health Services 31 802 10 117 843 29 979 10 137 436 29 827 10 770 463 21 692 5 405 27 097 10 796 259 29 352 11 134 063 29 437 11 512 202 29 470 11 774 738 2.8% 2.9% 53.6%3. Emergency Medical Services 2 624 998 795 2 495 1 022 603 2 475 1 049 361 2 427 36 2 463 1 068 411 2 467 1 200 076 2 425 1 151 493 2 471 1 227 943 0.1% 4.7% 5.4%4. Provincial Hospital Services 8 483 2 979 731 7 760 3 056 817 7 747 3 323 115 7 523 145 7 668 3 465 235 7 711 3 510 692 7 737 3 584 587 7 770 3 813 462 0.4% 3.2% 17.1%5. Central Hospital Services 6 435 3 409 840 5 931 3 196 308 6 134 3 465 164 5 677 %u2013 5 677 3 374 184 5 723 3 874 082 5 683 3 657 176 5 699 3 725 054 0.1% 3.4% 16.9%6. Health Sciences and Training 2 193 483 560 1 584 809 225 1 793 829 418 1 940 %u2013 1 940 780 562 1 933 881 942 1 929 894 694 1 899 936 374 -0.7% 6.3% 4.1%7. Health Care Support Services 176 69 782 168 70 240 169 71 912 159 10 169 74 742 169 84 074 181 86 529 197 92 275 5.2% 7.3% 0.4%8. Health Facilities Management 17 22 754 68 24 157 42 31 243 40 %u2013 40 31 660 40 46 612 52 47 458 59 50 399 13.8% 16.8% 0.2%Dir ect char ges %u2013 %u2013 %u2013 %u2013 %u2013 %u2013 %u2013 %u2013 %u2013 %u2013 %u2013 %u2013 %u2013 %u2013 %u2013 %u2013 %u2013 %u2013 %u2013Total 52 700 18 479 937 48 658 18 712 799 48 872 19 952 151 40 070 5 596 45 666 20 010 479 48 043 21 196 760 48 106 21 439 161 48 218 22 095 691 1.8% 3.4% 100.0%Employee dispensation classificationPublic Service Act appointees not covered by OSDs 13 649 4 536 243 13 649 4 276 518 13 634 5 003 817 13 649 1 13 650 4 976 426 13 760 4 770 790 13 760 4 971 566 13 760 5 257 631 0.3% 1.8% 23.9%Public Service Act appointees still to be covered by OSDs %u2013 %u2013 %u2013 %u2013 %u2013 %u2013 %u2013 %u2013 %u2013 %u2013 %u2013 %u2013 %u2013 %u2013 %u2013 %u2013 %u2013 %u2013 %u2013Professional Nurses, Staff Nurses and Nursing Assistants 24 374 9 478 688 19 101 9 274 964 20 370 9 103 274 11 553 %u2013 11 553 9 286 784 19 648 9 060 702 19 711 8 683 128 19 823 8 388 979 19.7% -3.3% 41.5%Legal Professionals 3 2 499 3 2 619 3 2 734 3 %u2013 3 6 368 5 5 057 5 5 354 5 5 663 18.6% -3.8% 0.0%Social Services Professions 117 69 102 117 72 419 117 75 605 117 %u2013 117 79 000 156 86 360 156 91 417 156 96 677 10.1% 7.0% 0.4%Engineering Professions and related occupations 116 %u2013 116 %u2013 116 %u2013 116 %u2013 116 %u2013 30 25 276 30 26 756 30 28 296 -36.3% %u2013 0.1%Medical and related professionals 5 240 2 877 599 6 471 3 497 715 5 431 4 108 260 5 431 %u2013 5 431 3 928 975 2 682 4 112 819 2 682 4 341 583 2 682 4 590 290 -21.0% 5.3% 20.2%Therapeutic, Diagnostic and other related Allied Health Professionals 1 251 689 477 1 251 722 572 1 251 754 365 1 251 %u2013 1 251 788 236 1 783 999 258 1 783 1 057 766 1 783 1 336 435 12.5% 19.2% 5.0%Educators and related professionals %u2013 %u2013 %u2013 %u2013 %u2013 %u2013 %u2013 %u2013 %u2013 %u2013 %u2013 %u2013 %u2013 %u2013 %u2013 %u2013 %u2013 %u2013 %u2013Others such as interns, EPWP, learnerships, etc 7 950 826 328 7 950 865 992 7 950 904 096 7 950 5 595 13 545 944 690 9 979 2 136 496 9 979 2 261 590 9 979 2 391 720 -9.7% 36.3% 8.8%Total 52 700 18 479 937 48 658 18 712 799 48 872 19 952 151 40 070 5 596 45 666 20 010 479 48 043 21 196 760 48 106 21 439 161 48 218 22 095 691 1.8% 3.4% 100.0% Average annual growth over MTEF 2021/22 2022/23 2023/24 2024/25 2025/26 2026/27 2027/28 2024/25 - 2027/28Table 34 above shows personnel numbers per programme and total costs for the department. The department%u2019s personnel numbers decreased from 52 700 in 2021/22 to a revised estimate of 45 666 in 2024/25 meanwhile, the personnel costs increased from R18.479 billion in 2021/22 to R20.010 billion in 2024/25. In 2021/22 there were personnel that was employed on contract basis to respond to the COVID-19 pandemic. In 2025/26, the personnel costs increase by 1.8 per cent from R20.010 billion to R21.196 billion when compared to the 2024/25 revised estimate due to additional funding for wage agreement. The positive increase is also evident with the increase in personnel number from 45 666 to 48 043. Professional Nurses, Staff Nurses and Nursing Assistants account for the highest number of staff with 19 648 officials in 2025/26. 196
