
Page 220 - Demo
P. 220
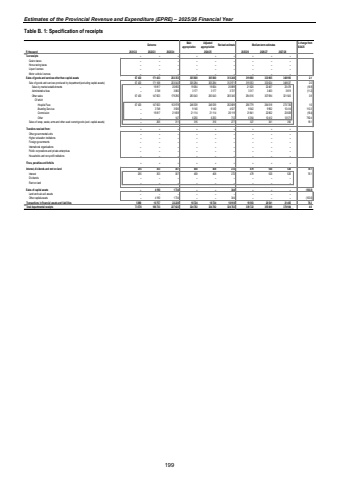
Estimates of the Provincial Revenue and Expenditure (EPRE) %u2013 2025/26 Financial YearTable B. 1: Specification of receipts Outcome Main appropriationAdjusted appropriation Revised estimate Medium-term estimates % change from 2024/25R thousand 2021/22 2022/23 2023/24 2025/26 2026/27 2027/28Tax receipts %u2013 %u2013 %u2013 %u2013 %u2013 %u2013 %u2013 %u2013 %u2013 Casino taxes %u2013 %u2013 %u2013 %u2013 %u2013 %u2013 %u2013 %u2013 %u2013 Horse racing taxes %u2013 %u2013 %u2013 %u2013 %u2013 %u2013 %u2013 %u2013 %u2013 Liquor licences %u2013 %u2013 %u2013 %u2013 %u2013 %u2013 %u2013 %u2013 %u2013 Motor vehicle licences %u2013 %u2013 %u2013 %u2013 %u2013 %u2013 %u2013 %u2013 %u2013 Sales of goods and services other than capital assets 67 433 171 433 203 353 305 600 305 600 313 248 319 680 333 965 348 993 2.1Sale of goods and services produced by department (excluding capital assets) 67 433 171 168 203 042 305 284 305 284 312 971 319 353 333 624 348 637 2.0Sales by market establishments %u2013 19 817 20 692 19 064 19 064 25 889 21 520 22 467 23 478 (16.9)Administrative fees 3 748 %u2013 3 060 3 177 3 177 3 737 3 317 3 463 3 619 (11.2)Other sales 67 433 147 603 179 290 283 043 283 043 283 345 294 516 307 694 321 540 3.9Of whichHospital Fees 67 433 147 603 153 978 246 539 246 539 252 689 256 779 264 518 273 726 1.6Boarding Services %u2013 3 748 3 506 9 140 9 140 4 537 9 542 9 962 10 414 110.3Commission %u2013 19 817 21 659 21 114 21 114 26 119 21 841 22 802 23 828 (16.4)Other %u2013 %u2013 147 6 250 6 250 712 6 354 10 412 13 571 792.4Sales of scrap, waste, arms and other used current goods (excl. capital assets) %u2013 265 311 316 316 277 327 341 356 18.1Transfers received from: %u2013 %u2013 %u2013 %u2013 %u2013 %u2013 %u2013 %u2013 %u2013Other governmental units %u2013 %u2013 %u2013 %u2013 %u2013 %u2013 %u2013 %u2013 %u2013Higher education institutions %u2013 %u2013 %u2013 %u2013 %u2013 %u2013 %u2013 %u2013 %u2013Foreign governments %u2013 %u2013 %u2013 %u2013 %u2013 %u2013 %u2013 %u2013 %u2013International organisations %u2013 %u2013 %u2013 %u2013 %u2013 %u2013 %u2013 %u2013 %u2013Public corporations and private enterprises %u2013 %u2013 %u2013 %u2013 %u2013 %u2013 %u2013 %u2013 %u2013Households and non-profit institutions %u2013 %u2013 %u2013 %u2013 %u2013 %u2013 %u2013 %u2013 %u2013Fines, penalties and forfeits %u2013 %u2013 %u2013 %u2013 %u2013 %u2013 %u2013 %u2013 %u2013Interest, dividends and rent on land 255 353 307 458 458 272 479 503 526 76.1Interest 255 353 307 458 458 272 479 503 526 76.1Dividends %u2013 %u2013 %u2013 %u2013 %u2013 %u2013 %u2013 %u2013 %u2013Rent on land %u2013 %u2013 %u2013 %u2013 %u2013 %u2013 %u2013 %u2013 %u2013Sales of capital assets %u2013 4 190 1 734 %u2013 %u2013 344 %u2013 %u2013 %u2013 (100.0)Land and sub-soil assets %u2013 %u2013 %u2013 %u2013 %u2013 %u2013 %u2013 %u2013 %u2013Other capital assets %u2013 4 190 1 734 %u2013 %u2013 344 %u2013 %u2013 %u2013 (100.0)Transactions in financial assets and liabilities 5 890 10 757 22 228 18 724 18 724 10 918 19 563 20 541 21 465 79.2Total departmental receipts 73 578 186 733 227 622 324 782 324 782 324 782 339 722 355 009 370 984 4.62024/25199
