
Page 221 - Demo
P. 221
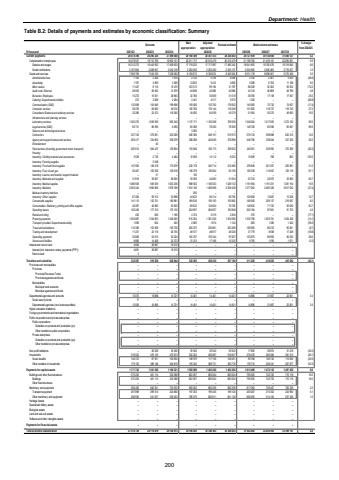
Department: HealthTable B.2: Details of payments and estimates by economic classification: Summary Outcome Main appropriationAdjusted appropriation Revised estimate Medium-term estimates % change from 2024/25R thousand 2021/22 2022/23 2023/24 2025/26 2026/27 2027/28Current payments 26 074 390 26 295 225 27 499 448 28 168 389 28 367 353 28 256 403 29 727 939 30 138 008 31 466 127 5.2Compensation of employees 18 479 937 18 712 799 19 952 151 20 011 717 20 010 479 20 010 479 21 196 760 21 439 161 22 095 691 5.9Salaries and wages 16 312 273 16 443 952 17 409 833 17 719 225 17 717 987 17 485 342 18 641 855 18 782 676 19 319 664 6.6Social contributions 2 167 664 2 268 847 2 542 318 2 292 492 2 292 492 2 525 137 2 554 905 2 656 485 2 776 027 1.2Goods and services 7 589 769 7 543 539 7 528 082 8 156 672 8 356 874 8 245 924 8 531 178 8 698 847 9 370 436 3.5Administrative fees 1 163 2 426 1 970 2 742 5 318 4 098 2 100 2 401 3 633 (48.8)Advertising 1 787 3 899 3 369 12 803 9 412 4 829 5 288 8 706 11 188 9.5Minor assets 11 447 8 116 15 475 103 313 99 194 31 787 86 528 52 300 56 552 172.2Audit costs: External 29 050 28 492 31 879 42 686 42 686 42 686 44 743 46 688 48 789 4.8Bursaries: Employees 15 272 15 551 28 863 32 766 30 809 31 018 38 785 17 138 17 947 25.0Catering: Departmental activities 272 2 068 2 284 3 441 4 517 3 975 1 320 %u2013 %u2013 (66.8)Communication (G&S) 133 088 154 849 199 696 193 626 133 782 176 822 145 983 70 732 74 957 (17.4)Computer services 56 278 84 820 49 010 192 706 176 144 119 248 151 820 118 737 119 743 27.3Consultants: Business and advisory services 22 286 22 473 118 360 54 825 64 939 43 579 51 954 50 275 49 692 19.2Infrastructure and planning services %u2013 %u2013 %u2013 %u2013 %u2013 %u2013 %u2013 %u2013 %u2013Laboratory services 1 305 270 1 039 939 902 342 1 137 171 1 105 568 709 509 1 348 004 1 217 655 1 272 120 90.0Legal services (G&S) 65 731 88 396 6 092 90 268 78 300 78 300 148 726 65 596 65 847 89.9Science and technological services %u2013 %u2013 %u2013 3 000 %u2013 %u2013 %u2013 %u2013 %u2013Contractors 327 743 375 851 353 009 490 386 546 191 515 973 578 133 598 888 622 312 12.0Agency and support/outsourced services 283 417 334 662 356 079 388 208 424 649 370 898 446 796 338 644 337 250 20.5Entertainment %u2013 40 %u2013 %u2013 %u2013 %u2013 %u2013 %u2013 %u2013Fleet services (including government motor transport) 205 012 264 437 130 804 153 646 100 173 329 652 243 051 330 905 375 369 (26.3)Housing %u2013 %u2013 %u2013 %u2013 %u2013 %u2013 %u2013 %u2013 %u2013Inventory: Clothing material and accessories 3 538 2 735 4 464 12 839 14 112 6 523 15 609 768 803 139.3Inventory: Farming supplies %u2013 2 949 %u2013 %u2013 %u2013 %u2013 %u2013 %u2013 %u2013Inventory: Food and food supplies 147 560 148 219 173 679 230 178 345 714 212 480 278 848 201 257 205 981 31.2Inventory: Fuel, oil and gas 50 407 102 925 105 618 156 278 120 064 63 159 105 538 114 947 120 119 67.1Inventory: Learner and teacher support material %u2013 31 %u2013 150 %u2013 %u2013 %u2013 %u2013 %u2013Inventory: Materials and supplies 31 818 39 857 60 602 53 559 44 083 31 834 52 743 22 872 23 900 65.7Inventory: Medical supplies 1 086 558 949 039 1 003 236 988 922 1 106 503 1 028 132 1 191 694 1 191 251 1 281 194 15.9Inventory: Medicine 2 003 444 1 890 856 1 878 768 1 910 156 1 469 998 2 039 438 1 277 263 2 485 329 2 817 032 (37.4)Medsas inventory interface %u2013 %u2013 %u2013 290 %u2013 %u2013 %u2013 %u2013 %u2013Inventory: Other supplies 67 406 58 313 53 898 44 623 84 314 58 756 102 658 12 687 13 258 74.7Consumable supplies 141 113 122 701 180 881 189 036 159 183 155 850 168 582 209 137 219 087 8.2Consumables: Stationery, printing and office supplies 46 287 40 865 53 922 89 622 134 604 76 729 148 635 71 723 92 630 93.7Operating leases 165 246 177 310 170 132 234 997 264 807 193 848 202 184 87 801 91 753 4.3Rental and hiring 432 636 1 160 4 374 3 519 2 494 570 %u2013 %u2013 (77.1)Property payments 1 203 887 1 334 853 1 346 005 915 054 1 381 230 1 554 996 1 335 796 1 203 761 1 254 328 (14.1)Transport provided: Departmental activity 1 096 624 403 2 665 1 874 1 124 683 1 380 1 442 (39.2)Travel and subsistence 110 396 153 568 193 730 226 275 235 861 203 499 185 695 86 210 90 061 (8.7)Training and development 11 231 23 116 26 755 48 517 48 817 46 526 37 779 8 568 17 248 (18.8)Operating payments 52 668 54 515 52 224 126 337 103 344 97 827 123 875 80 892 84 530 26.6Venues and facilities 8 866 14 408 23 373 21 213 17 166 10 335 9 795 1 599 1 671 (5.2)Interest and rent on land 4 684 38 887 19 215 %u2013 %u2013 %u2013 %u2013 %u2013 %u2013Interest (Incl. interest on unitary payments (PPP)) 4 681 38 887 19 215 %u2013 %u2013 %u2013 %u2013 %u2013 %u2013Rent on land 3 %u2013 %u2013 %u2013 %u2013 %u2013 %u2013 %u2013 %u2013Transfers and subsidies 332 597 519 529 520 844 352 565 456 230 567 180 311 256 416 825 435 582 (45.1)Provinces and municipalities %u2013 %u2013 %u2013 %u2013 %u2013 %u2013 %u2013 %u2013 %u2013Provinces %u2013 %u2013 %u2013 %u2013 %u2013 %u2013 %u2013 %u2013 %u2013Provincial Revenue Funds %u2013 %u2013 %u2013 %u2013 %u2013 %u2013 %u2013 %u2013 %u2013Provincial agencies and funds %u2013 %u2013 %u2013 %u2013 %u2013 %u2013 %u2013 %u2013 %u2013Municipalities %u2013 %u2013 %u2013 %u2013 %u2013 %u2013 %u2013 %u2013 %u2013Municipal bank accounts %u2013 %u2013 %u2013 %u2013 %u2013 %u2013 %u2013 %u2013 %u2013Municipal agencies and funds %u2013 %u2013 %u2013 %u2013 %u2013 %u2013 %u2013 %u2013 %u2013Departmental agencies and accounts 13 075 16 866 14 721 14 401 14 401 14 401 14 886 21 867 22 851 3.4Social security funds 17 %u2013 %u2013 %u2013 %u2013 %u2013 %u2013 %u2013 %u2013Departmental agencies (non-business entities) 13 058 16 866 14 721 14 401 14 401 14 401 14 886 21 867 22 851 3.4Higher education institutions %u2013 %u2013 %u2013 %u2013 %u2013 %u2013 %u2013 %u2013 %u2013Foreign governments and international organisations %u2013 %u2013 %u2013 %u2013 %u2013 %u2013 %u2013 %u2013 %u2013Public corporations and private enterprises %u2013 %u2013 %u2013 %u2013 %u2013 %u2013 %u2013 %u2013 %u2013Public corporations %u2013 %u2013 %u2013 %u2013 %u2013 %u2013 %u2013 %u2013 %u2013Subsidies on products and production (pc) %u2013 %u2013 %u2013 %u2013 %u2013 %u2013 %u2013 %u2013 %u2013Other transfers to public corporations %u2013 %u2013 %u2013 %u2013 %u2013 %u2013 %u2013 %u2013 %u2013Private enterprises %u2013 %u2013 %u2013 %u2013 %u2013 %u2013 %u2013 %u2013 %u2013Subsidies on products and production (pe) %u2013 %u2013 %u2013 %u2013 %u2013 %u2013 %u2013 %u2013 %u2013Other transfers to private enterprises %u2013 %u2013 %u2013 %u2013 %u2013 %u2013 %u2013 %u2013 %u2013Non-profit institutions %u2013 26 528 35 450 35 942 35 942 35 942 17 892 29 874 31 218 (50.2)Households 319 522 476 135 470 673 302 222 405 887 516 837 278 478 365 084 381 513 (46.1)Social benefits 140 372 87 951 105 854 108 979 117 156 126 061 99 768 108 743 113 636 (20.9)Other transfers to households 179 150 388 184 364 819 193 243 288 731 390 776 178 710 256 341 267 877 (54.3)Payments for capital assets 1 171 742 1 301 665 1 106 521 1 585 889 1 483 260 1 483 260 1 613 488 1 472 132 1 497 458 8.8Buildings and other fixed structures 575 252 461 114 352 588 602 057 683 004 683 004 795 925 742 725 715 119 16.5Buildings 575 252 461 114 352 588 602 057 683 004 683 004 795 925 742 725 715 119 16.5Other fixed structures %u2013 %u2013 %u2013 %u2013 %u2013 %u2013 %u2013 %u2013 %u2013Machinery and equipment 596 490 840 551 753 933 983 832 800 256 800 256 817 562 729 407 782 339 2.2Transport equipment 297 898 299 514 224 680 197 253 199 445 199 120 209 267 215 302 224 990 5.1Other machinery and equipment 298 592 541 037 529 253 786 579 600 811 601 136 608 295 514 105 557 349 1.2Heritage Assets %u2013 %u2013 %u2013 %u2013 %u2013 %u2013 %u2013 %u2013 %u2013Specialised military assets %u2013 %u2013 %u2013 %u2013 %u2013 %u2013 %u2013 %u2013 %u2013Biological assets %u2013 %u2013 %u2013 %u2013 %u2013 %u2013 %u2013 %u2013 %u2013Land and sub-soil assets %u2013 %u2013 %u2013 %u2013 %u2013 %u2013 %u2013 %u2013 %u2013Software and other intangible assets %u2013 %u2013 %u2013 %u2013 %u2013 %u2013 %u2013 %u2013 %u2013Payments for financial assets %u2013 %u2013 %u2013 %u2013 %u2013 %u2013 %u2013 %u2013 %u2013Total economic classification 27 578 729 28 116 419 29 126 813 30 106 843 30 306 843 30 306 843 31 652 682 32 026 965 33 399 167 4.42024/25200
