
Page 224 - Demo
P. 224
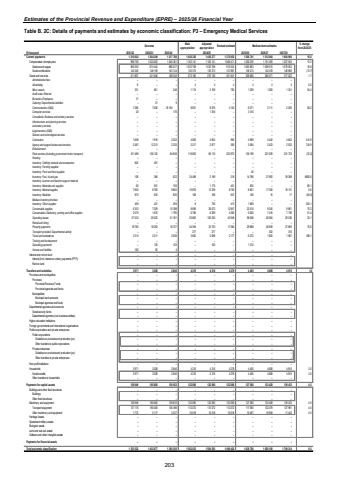
Estimates of the Provincial Revenue and Expenditure (EPRE) %u2013 2025/26 Financial YearTable B. 2C: Details of payments and estimates by economic classification: P3 %u2013 Emergency Medical Services Outcome Main appropriationAdjusted appropriation Revised estimate Medium-term estimates % change from 2024/25R thousand 2021/22 2022/23 2023/24 2025/26 2026/27 2027/28Current payments 1 264 249 1 210 602 1 217 706 1 436 326 1 438 277 1 370 052 1 506 741 1 512 064 1 604 966 10.0Compensation of employees 998 795 1 022 603 1 049 361 1 163 141 1 163 141 1 068 411 1 200 076 1 151 493 1 227 943 12.3Salaries and wages 856 555 874 444 886 237 1 032 768 1 032 768 910 524 1 063 863 1 009 015 1 079 053 16.8Social contributions 142 240 148 159 163 124 130 373 130 373 157 887 136 213 142 478 148 890 (13.7)Goods and services 211 807 241 646 168 345 273 185 275 136 301 641 306 665 360 571 377 023 1.7Administrative fees %u2013 %u2013 %u2013 %u2013 %u2013 %u2013 %u2013 %u2013 %u2013 Advertising %u2013 8 %u2013 4 4 4 4 4 4 0.0Minor assets 461 331 346 1 174 2 109 783 1 209 1 283 1 341 54.4Audit costs: External %u2013 %u2013 %u2013 %u2013 %u2013 %u2013 %u2013 %u2013 %u2013Bursaries: Employees 31 %u2013 %u2013 %u2013 %u2013 %u2013 %u2013 %u2013 %u2013Catering: Departmental activities %u2013 21 9 %u2013 %u2013 %u2013 %u2013 %u2013 %u2013Communication (G&S) 7 366 -18 104 7 636 8 651 8 076 4 154 6 571 2 111 2 206 58.2Computer services 20 %u2013 176 %u2013 1 350 %u2013 3 410 %u2013 %u2013Consultants: Business and advisory services %u2013 %u2013 %u2013 %u2013 %u2013 %u2013 %u2013 %u2013 %u2013Infrastructure and planning services %u2013 %u2013 %u2013 %u2013 %u2013 %u2013 %u2013 %u2013 %u2013Laboratory services %u2013 %u2013 %u2013 %u2013 %u2013 %u2013 %u2013 %u2013 %u2013Legal services (G&S) %u2013 %u2013 %u2013 %u2013 %u2013 %u2013 %u2013 %u2013 %u2013Science and technological services %u2013 %u2013 %u2013 %u2013 %u2013 %u2013 %u2013 %u2013 %u2013Contractors 1 658 1 918 2 022 4 065 4 604 965 4 969 4 442 4 642 414.9Agency and support/outsourced services 2 487 12 213 2 325 2 217 2 877 365 3 084 2 423 2 532 744.9Entertainment %u2013 %u2013 %u2013 %u2013 %u2013 %u2013 %u2013 %u2013 %u2013Fleet services (including government motor transport) 101 489 156 125 84 836 116 852 66 110 203 975 136 199 221 539 231 733 (33.2)Housing %u2013 %u2013 %u2013 %u2013 %u2013 %u2013 %u2013 %u2013 %u2013Inventory: Clothing material and accessories 842 491 %u2013 %u2013 %u2013 %u2013 %u2013 %u2013 %u2013Inventory: Farming supplies %u2013 %u2013 %u2013 %u2013 %u2013 %u2013 %u2013 %u2013 %u2013Inventory: Food and food supplies %u2013 %u2013 %u2013 %u2013 %u2013 %u2013 40 %u2013 %u2013Inventory: Fuel, oil and gas 138 366 622 24 489 2 189 218 14 786 37 692 39 388 6682.6Inventory: Learner and teacher support material %u2013 %u2013 %u2013 %u2013 %u2013 %u2013 %u2013 %u2013 %u2013Inventory: Materials and supplies 60 931 193 %u2013 1 170 451 835 %u2013 %u2013 85.1Inventory: Medical supplies 7 855 8 782 9 862 15 876 13 329 8 750 8 801 17 350 18 131 0.6Inventory: Medicine 870 635 830 168 168 647 100 16 17 (84.5)Medsas inventory interface %u2013 %u2013 %u2013 %u2013 %u2013 %u2013 %u2013 %u2013 %u2013Inventory: Other supplies 409 421 294 8 736 413 1 669 %u2013 %u2013 304.1Consumable supplies 6 353 7 029 10 398 8 699 26 672 12 847 22 510 9 245 9 661 75.2Consumables: Stationery, printing and office supplies 2 079 1 870 1 795 6 786 6 269 4 360 6 600 7 416 7 750 51.4Operating leases 57 532 20 032 51 351 55 863 100 255 43 948 58 508 28 264 29 536 33.1Rental and hiring %u2013 %u2013 %u2013 %u2013 %u2013 %u2013 %u2013 %u2013 %u2013Property payments 18 782 18 292 18 727 24 394 33 753 17 584 29 888 26 659 27 859 70.0Transport provided: Departmental activity %u2013 %u2013 %u2013 277 277 %u2013 %u2013 302 316Travel and subsistence 3 315 4 211 2 556 3 662 5 088 2 177 6 272 1 825 1 907 188.1Training and development %u2013 %u2013 %u2013 %u2013 %u2013 %u2013 %u2013 %u2013 %u2013Operating payments %u2013 120 103 %u2013 100 %u2013 1 210 %u2013 %u2013Venues and facilities 182 92 4 %u2013 %u2013 %u2013 %u2013 %u2013 %u2013Interest and rent on land %u2013 %u2013 %u2013 %u2013 %u2013 %u2013 %u2013 %u2013 %u2013Interest (Incl. interest on unitary payments (PPP)) %u2013 %u2013 %u2013 %u2013 %u2013 %u2013 %u2013 %u2013 %u2013Rent on land %u2013 %u2013 %u2013 %u2013 %u2013 %u2013 %u2013 %u2013 %u2013Transfers and subsidies 3 971 3 028 2 846 4 216 4 216 4 278 4 405 4 608 4 815 3.0 Provinces and municipalities %u2013 %u2013 %u2013 %u2013 %u2013 %u2013 %u2013 %u2013 %u2013Provinces %u2013 %u2013 %u2013 %u2013 %u2013 %u2013 %u2013 %u2013 %u2013Provincial Revenue Funds %u2013 %u2013 %u2013 %u2013 %u2013 %u2013 %u2013 %u2013 %u2013Provincial agencies and funds %u2013 %u2013 %u2013 %u2013 %u2013 %u2013 %u2013 %u2013 %u2013Municipalities %u2013 %u2013 %u2013 %u2013 %u2013 %u2013 %u2013 %u2013 %u2013Municipal bank accounts %u2013 %u2013 %u2013 %u2013 %u2013 %u2013 %u2013 %u2013 %u2013Municipal agencies and funds %u2013 %u2013 %u2013 %u2013 %u2013 %u2013 %u2013 %u2013 %u2013Departmental agencies and accounts %u2013 %u2013 %u2013 %u2013 %u2013 %u2013 %u2013 %u2013 %u2013Social security funds %u2013 %u2013 %u2013 %u2013 %u2013 %u2013 %u2013 %u2013 %u2013Departmental agencies (non-business entities) %u2013 %u2013 %u2013 %u2013 %u2013 %u2013 %u2013 %u2013 %u2013Higher education institutions %u2013 %u2013 %u2013 %u2013 %u2013 %u2013 %u2013 %u2013 %u2013Foreign governments and international organisations %u2013 %u2013 %u2013 %u2013 %u2013 %u2013 %u2013 %u2013 %u2013Public corporations and private enterprises %u2013 %u2013 %u2013 %u2013 %u2013 %u2013 %u2013 %u2013 %u2013Public corporations %u2013 %u2013 %u2013 %u2013 %u2013 %u2013 %u2013 %u2013 %u2013Subsidies on products and production (pc) %u2013 %u2013 %u2013 %u2013 %u2013 %u2013 %u2013 %u2013 %u2013Other transfers to public corporations %u2013 %u2013 %u2013 %u2013 %u2013 %u2013 %u2013 %u2013 %u2013Private enterprises %u2013 %u2013 %u2013 %u2013 %u2013 %u2013 %u2013 %u2013 %u2013Subsidies on products and production (pe) %u2013 %u2013 %u2013 %u2013 %u2013 %u2013 %u2013 %u2013 %u2013Other transfers to private enterprises %u2013 %u2013 %u2013 %u2013 %u2013 %u2013 %u2013 %u2013 %u2013Non-profit institutions %u2013 %u2013 %u2013 %u2013 %u2013 %u2013 %u2013 %u2013 %u2013Households 3 971 3 028 2 846 4 216 4 216 4 278 4 405 4 608 4 815 3.0Social benefits 3 971 3 028 2 846 4 216 4 216 4 278 4 405 4 608 4 815 3.0Other transfers to households %u2013 %u2013 %u2013 %u2013 %u2013 %u2013 %u2013 %u2013 %u2013Payments for capital assets 138 949 185 600 139 833 122 090 122 090 122 090 127 560 133 428 139 433 4.5Buildings and other fixed structures %u2013 %u2013 %u2013 %u2013 %u2013 %u2013 %u2013 %u2013 %u2013Buildings %u2013 %u2013 %u2013 %u2013 %u2013 %u2013 %u2013 %u2013 %u2013Other fixed structures %u2013 %u2013 %u2013 %u2013 %u2013 %u2013 %u2013 %u2013 %u2013Machinery and equipment 138 949 185 600 139 833 122 090 122 090 122 090 127 560 133 428 139 433 4.5Transport equipment 137 176 180 483 136 496 112 072 112 072 112 072 117 093 122 479 127 991 4.5Other machinery and equipment 1 773 5 117 3 337 10 018 10 018 10 018 10 467 10 949 11 442 4.5Heritage Assets %u2013 %u2013 %u2013 %u2013 %u2013 %u2013 %u2013 %u2013 %u2013Specialised military assets %u2013 %u2013 %u2013 %u2013 %u2013 %u2013 %u2013 %u2013 %u2013Biological assets %u2013 %u2013 %u2013 %u2013 %u2013 %u2013 %u2013 %u2013 %u2013Land and sub-soil assets %u2013 %u2013 %u2013 %u2013 %u2013 %u2013 %u2013 %u2013 %u2013Software and other intangible assets %u2013 %u2013 %u2013 %u2013 %u2013 %u2013 %u2013 %u2013 %u2013Payments for financial assets %u2013 %u2013 %u2013 %u2013 %u2013 %u2013 %u2013 %u2013 %u2013Total economic classification 1 353 522 1 452 877 1 360 385 1 562 632 1 564 583 1 496 420 1 638 706 1 650 100 1 749 214 9.52024/25203
