
Page 222 - Demo
P. 222
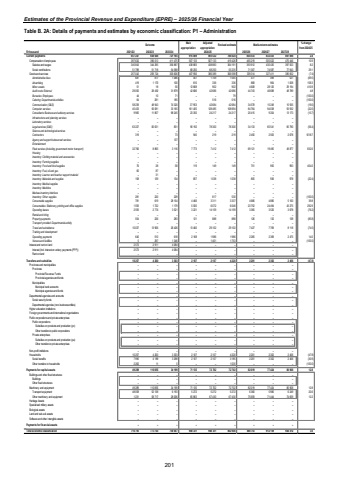
Estimates of the Provincial Revenue and Expenditure (EPRE) %u2013 2025/26 Financial YearTable B. 2A: Details of payments and estimates by economic classification: P1 %u2013 Administration Outcome Main appropriationAdjusted appropriation Revised estimate Medium-term estimates % change from 2024/25R thousand 2021/22 2022/23 2023/24 2025/26 2026/27 2027/28Current payments 658 648 657 247 721 165 915 089 893 522 786 024 804 533 832 433 861 098 2.4Compensation of employees 397 632 396 013 411 475 507 133 507 133 419 426 465 219 505 022 475 446 10.9Salaries and wages 345 843 344 295 356 887 438 883 438 883 364 191 393 912 430 435 397 503 8.2Social contributions 51 789 51 718 54 588 68 250 68 250 55 235 71 307 74 587 77 943 29.1Goods and services 257 042 259 724 305 606 407 956 386 389 366 598 339 314 327 411 385 652 (7.4)Administrative fees 687 877 1 486 457 1 709 1 565 477 499 521 (69.5)Advertising 419 1 170 100 610 336 336 868 964 1 008 158.3Minor assets 51 18 50 12 668 902 902 4 608 28 120 29 194 410.9Audit costs: External 29 050 28 492 31 879 42 686 42 686 42 686 44 743 46 688 48 789 4.8Bursaries: Employees 44 10 71 %u2013 %u2013 79 %u2013 %u2013 %u2013 (100.0)Catering: Departmental activities 64 281 185 %u2013 516 516 %u2013 %u2013 %u2013 (100.0)Communication (G&S) 58 239 48 943 74 320 37 953 42 684 42 684 34 578 15 249 15 935 (19.0)Computer services 45 433 56 081 33 165 161 405 128 485 108 694 84 764 94 038 93 932 (22.0)Consultants: Business and advisory services 9 965 11 807 98 245 23 350 24 217 24 217 20 415 9 204 13 173 (15.7)Infrastructure and planning services %u2013 %u2013 %u2013 %u2013 %u2013 %u2013 %u2013 %u2013 %u2013Laboratory services %u2013 %u2013 %u2013 %u2013 %u2013 %u2013 %u2013 %u2013 %u2013Legal services (G&S) 63 227 82 631 831 90 192 78 300 78 300 34 133 65 541 65 790 (56.4)Science and technological services %u2013 %u2013 %u2013 %u2013 %u2013 %u2013 %u2013 %u2013 %u2013Contractors 319 %u2013 73 945 219 219 2 450 2 563 2 678 1018.7Agency and support/outsourced services %u2013 %u2013 137 %u2013 %u2013 %u2013 %u2013 %u2013 %u2013Entertainment %u2013 %u2013 %u2013 %u2013 %u2013 %u2013 %u2013 %u2013 %u2013Fleet services (including government motor transport) 32 766 8 865 3 116 7 773 7 412 7 412 69 121 19 495 49 877 832.6Housing %u2013 %u2013 %u2013 %u2013 %u2013 %u2013 %u2013 %u2013 %u2013Inventory: Clothing material and accessories %u2013 %u2013 %u2013 %u2013 %u2013 %u2013 %u2013 %u2013 %u2013Inventory: Farming supplies %u2013 %u2013 %u2013 %u2013 %u2013 %u2013 %u2013 %u2013 %u2013Inventory: Food and food supplies 76 28 58 119 149 149 751 950 993 404.0Inventory: Fuel, oil and gas 60 87 %u2013 %u2013 %u2013 %u2013 %u2013 %u2013 %u2013Inventory: Learner and teacher support material %u2013 31 %u2013 %u2013 %u2013 %u2013 %u2013 %u2013 %u2013Inventory: Materials and supplies 158 129 134 857 1 038 1 038 805 936 978 (22.4)Inventory: Medical supplies %u2013 %u2013 %u2013 %u2013 %u2013 %u2013 %u2013 %u2013 %u2013Inventory: Medicine %u2013 %u2013 %u2013 %u2013 %u2013 %u2013 %u2013 %u2013 %u2013Medsas inventory interface %u2013 %u2013 %u2013 %u2013 %u2013 %u2013 %u2013 %u2013 %u2013Inventory: Other supplies 281 220 229 %u2013 817 530 %u2013 %u2013 %u2013 (100.0)Consumable supplies 781 619 28 154 4 466 3 311 3 337 4 666 4 880 5 100 39.8Consumables: Stationery, printing and office supplies 1 593 1 722 1 179 5 505 6 072 6 046 23 752 24 494 43 275 292.9Operating leases 2 593 2 774 3 521 3 221 14 159 14 159 3 365 3 520 3 678 (76.2)Rental and hiring %u2013 %u2013 %u2013 %u2013 %u2013 %u2013 %u2013 %u2013 %u2013Property payments 554 226 283 121 888 888 126 132 138 (85.8)Transport provided: Departmental activity %u2013 %u2013 %u2013 %u2013 %u2013 %u2013 %u2013 %u2013 %u2013Travel and subsistence 10 037 13 906 26 426 13 460 29 102 29 102 7 427 7 769 8 118 (74.5)Training and development %u2013 %u2013 %u2013 %u2013 %u2013 %u2013 %u2013 %u2013 %u2013Operating payments 640 510 618 2 168 1 986 1 986 2 265 2 369 2 475 14.0Venues and facilities 5 297 1 346 %u2013 1 401 1 753 %u2013 %u2013 %u2013 (100.0)Interest and rent on land 2 573 2 911 4 084 %u2013 %u2013 %u2013 %u2013 %u2013 %u2013Interest (Incl. interest on unitary payments (PPP)) 2 573 2 911 4 084 %u2013 %u2013 %u2013 %u2013 %u2013 %u2013Rent on land %u2013 %u2013 %u2013 %u2013 %u2013 %u2013 %u2013 %u2013 %u2013Transfers and subsidies 10 257 4 200 3 303 2 107 2 107 4 220 2 201 2 302 2 406 (47.8)Provinces and municipalities %u2013 %u2013 %u2013 %u2013 %u2013 %u2013 %u2013 %u2013 %u2013Provinces %u2013 %u2013 %u2013 %u2013 %u2013 %u2013 %u2013 %u2013 %u2013Provincial Revenue Funds %u2013 %u2013 %u2013 %u2013 %u2013 %u2013 %u2013 %u2013 %u2013Provincial agencies and funds %u2013 %u2013 %u2013 %u2013 %u2013 %u2013 %u2013 %u2013 %u2013Municipalities %u2013 %u2013 %u2013 %u2013 %u2013 %u2013 %u2013 %u2013 %u2013Municipal bank accounts %u2013 %u2013 %u2013 %u2013 %u2013 %u2013 %u2013 %u2013 %u2013Municipal agencies and funds %u2013 %u2013 %u2013 %u2013 %u2013 %u2013 %u2013 %u2013 %u2013Departmental agencies and accounts %u2013 %u2013 %u2013 %u2013 %u2013 %u2013 %u2013 %u2013 %u2013Social security funds %u2013 %u2013 %u2013 %u2013 %u2013 %u2013 %u2013 %u2013 %u2013Departmental agencies (non-business entities) %u2013 %u2013 %u2013 %u2013 %u2013 %u2013 %u2013 %u2013 %u2013Higher education institutions %u2013 %u2013 %u2013 %u2013 %u2013 %u2013 %u2013 %u2013 %u2013Foreign governments and international organisations %u2013 %u2013 %u2013 %u2013 %u2013 %u2013 %u2013 %u2013 %u2013Public corporations and private enterprises %u2013 %u2013 %u2013 %u2013 %u2013 %u2013 %u2013 %u2013 %u2013Public corporations %u2013 %u2013 %u2013 %u2013 %u2013 %u2013 %u2013 %u2013 %u2013Subsidies on products and production (pc) %u2013 %u2013 %u2013 %u2013 %u2013 %u2013 %u2013 %u2013 %u2013Other transfers to public corporations %u2013 %u2013 %u2013 %u2013 %u2013 %u2013 %u2013 %u2013 %u2013Private enterprises %u2013 %u2013 %u2013 %u2013 %u2013 %u2013 %u2013 %u2013 %u2013Subsidies on products and production (pe) %u2013 %u2013 %u2013 %u2013 %u2013 %u2013 %u2013 %u2013 %u2013Other transfers to private enterprises %u2013 %u2013 %u2013 %u2013 %u2013 %u2013 %u2013 %u2013 %u2013Non-profit institutions %u2013 %u2013 %u2013 %u2013 %u2013 %u2013 %u2013 %u2013 %u2013Households 10 257 4 200 3 303 2 107 2 107 4 220 2 201 2 302 2 406 (47.8)Social benefits 7 995 4 189 3 298 2 107 2 107 3 185 2 201 2 302 2 406 (30.9)Other transfers to households 2 262 11 5 %u2013 %u2013 1 035 %u2013 %u2013 %u2013 (100.0)Payments for capital assets 49 289 110 855 34 199 71 135 72 702 72 702 82 019 77 424 80 908 12.8Buildings and other fixed structures %u2013 %u2013 %u2013 %u2013 %u2013 %u2013 %u2013 %u2013 %u2013Buildings %u2013 %u2013 %u2013 %u2013 %u2013 %u2013 %u2013 %u2013 %u2013Other fixed structures %u2013 %u2013 %u2013 %u2013 %u2013 %u2013 %u2013 %u2013 %u2013Machinery and equipment 49 289 110 855 34 199 71 135 72 702 72 702 82 019 77 424 80 908 12.8Transport equipment 48 058 52 138 6 193 5 272 5 272 5 272 6 360 5 980 6 249 20.6Other machinery and equipment 1 231 58 717 28 006 65 863 67 430 67 430 75 659 71 444 74 659 12.2Heritage Assets %u2013 %u2013 %u2013 %u2013 %u2013 %u2013 %u2013 %u2013 %u2013Specialised military assets %u2013 %u2013 %u2013 %u2013 %u2013 %u2013 %u2013 %u2013 %u2013Biological assets %u2013 %u2013 %u2013 %u2013 %u2013 %u2013 %u2013 %u2013 %u2013Land and sub-soil assets %u2013 %u2013 %u2013 %u2013 %u2013 %u2013 %u2013 %u2013 %u2013Software and other intangible assets %u2013 %u2013 %u2013 %u2013 %u2013 %u2013 %u2013 %u2013 %u2013Payments for financial assets %u2013 %u2013 %u2013 %u2013 %u2013 %u2013 %u2013 %u2013 %u2013Total economic classification 716 793 773 703 758 667 988 331 968 331 862 946 888 753 912 159 944 412 3.02024/25201
