
Page 223 - Demo
P. 223
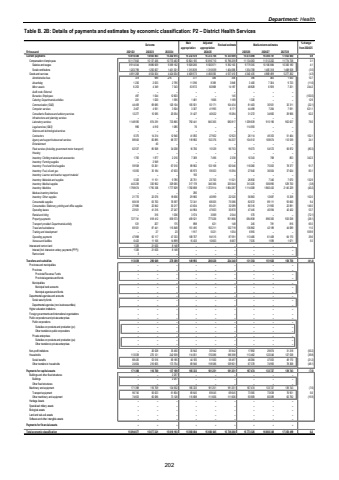
Department: HealthTable B. 2B: Details of payments and estimates by economic classification: P2 %u2013 District Health Services Outcome Main appropriationAdjusted appropriation Revised estimate Medium-term estimates % change from 2024/25R thousand 2021/22 2022/23 2023/24 2025/26 2026/27 2027/28Current payments 14 810 440 14 663 863 15 202 615 15 232 678 15 272 766 15 333 669 15 474 498 16 380 701 17 052 000 0.9Compensation of employees 10 117 843 10 137 436 10 770 463 10 824 105 10 816 710 10 796 259 11 134 063 11 512 202 11 774 738 3.1Salaries and wages 8 914 044 8 886 609 9 369 162 9 508 266 9 500 871 9 392 163 9 779 355 10 106 884 10 306 180 4.1Social contributions 1 203 799 1 250 827 1 401 301 1 315 839 1 315 839 1 404 096 1 354 708 1 405 318 1 468 558 (3.5)Goods and services 4 691 268 4 504 824 4 424 004 4 408 573 4 456 056 4 537 410 4 340 435 4 868 499 5 277 262 (4.3)Administrative fees 378 -215 989 377 484 358 396 460 1 500 10.7Advertising 1 230 2 633 2 795 11 396 8 369 3 848 3 400 7 304 9 723 (11.6)Minor assets 6 253 4 349 7 343 63 972 60 868 14 187 48 828 6 939 7 251 244.2Audit costs: External %u2013 %u2013 %u2013 %u2013 %u2013 %u2013 %u2013 %u2013 %u2013Bursaries: Employees 497 1 044 12 603 %u2013 %u2013 145 %u2013 %u2013 %u2013 (100.0)Catering: Departmental activities 201 1 020 1 595 1 481 1 666 1 169 1 320 %u2013 %u2013 12.9Communication (G&S) 44 459 69 685 120 104 105 501 55 171 104 434 81 403 30 921 32 311 (22.1)Computer services 2 407 4 561 3 924 3 307 41 995 6 171 44 498 7 264 7 591 621.1Consultants: Business and advisory services 12 277 10 585 20 054 31 427 40 622 19 284 31 272 34 800 29 966 62.2Infrastructure and planning services %u2013 %u2013 %u2013 %u2013 %u2013 %u2013 %u2013 %u2013 %u2013Laboratory services 1 148 595 874 291 733 865 792 441 845 365 580 817 1 039 639 915 196 952 627 79.0Legal services (G&S) 996 4 810 1 085 76 %u2013 114 593 %u2013 %u2013 %u2013Science and technological services %u2013 %u2013 %u2013 %u2013 %u2013 %u2013 %u2013 %u2013 %u2013Contractors 6 375 14 214 12 940 41 092 27 902 12 923 26 114 49 353 51 464 102.1Agency and support/outsourced services 88 843 82 885 68 737 118 982 132 376 84 237 104 512 108 674 112 539 24.1Entertainment %u2013 40 %u2013 %u2013 %u2013 %u2013 %u2013 %u2013 %u2013Fleet services (including government motor transport) 62 537 85 568 34 038 16 706 15 529 96 753 19 073 54 572 56 872 (80.3)Housing %u2013 %u2013 %u2013 %u2013 %u2013 %u2013 %u2013 %u2013 %u2013Inventory: Clothing material and accessories 1 705 1 877 2 210 7 369 7 496 2 338 10 343 768 803 342.3Inventory: Farming supplies %u2013 2 949 %u2013 %u2013 %u2013 %u2013 %u2013 %u2013 %u2013Inventory: Food and food supplies 59 938 53 261 67 010 89 962 133 168 60 546 116 060 75 003 78 377 91.7Inventory: Fuel, oil and gas 15 055 35 184 47 633 65 973 59 003 15 094 27 640 36 004 37 624 83.1Inventory: Learner and teacher support material %u2013 %u2013 %u2013 150 %u2013 %u2013 %u2013 %u2013 %u2013Inventory: Materials and supplies 5 320 11 151 9 785 25 751 23 700 11 521 26 830 7 340 7 670 132.9Inventory: Medical supplies 443 239 330 962 329 065 317 178 346 366 325 644 313 225 506 890 529 700 (3.8)Inventory: Medicine 1 798 674 1 795 306 1 777 829 1 782 698 1 372 914 1 864 287 1 114 008 1 860 432 2 145 229 (40.2)Medsas inventory interface %u2013 %u2013 %u2013 290 %u2013 %u2013 %u2013 %u2013 %u2013Inventory: Other supplies 21 770 22 076 18 656 29 960 40 899 22 520 56 863 12 687 13 258 152.5Consumable supplies 66 618 63 700 76 597 72 341 68 005 75 586 82 672 89 111 93 660 9.4Consumables: Stationery, printing and office supplies 27 886 22 842 30 217 43 634 85 431 32 589 80 316 21 905 22 891 146.5Operating leases 23 921 41 216 27 247 44 964 47 603 30 870 47 445 40 594 42 422 53.7Rental and hiring %u2013 316 1 036 3 574 3 069 2 044 570 %u2013 %u2013 (72.1)Property payments 727 741 818 412 839 573 459 521 777 026 951 866 684 838 896 305 933 038 (28.1)Transport provided: Departmental activity 531 207 175 898 621 148 245 781 816 65.5Travel and subsistence 69 501 87 441 115 848 151 495 150 211 122 719 136 862 42 189 44 089 11.5Training and development %u2013 27 23 1 917 5 021 1 054 6 955 %u2013 %u2013 559.9Operating payments 47 898 50 117 47 333 108 707 94 515 87 591 113 480 61 408 64 170 29.6Venues and facilities 6 423 11 106 14 899 15 433 10 663 6 667 7 035 1 599 1 671 5.5Interest and rent on land 1 329 21 603 8 148 %u2013 %u2013 %u2013 %u2013 %u2013 %u2013Interest (Incl. interest on unitary payments (PPP)) 1 326 21 603 8 148 %u2013 %u2013 %u2013 %u2013 %u2013 %u2013Rent on land 3 %u2013 %u2013 %u2013 %u2013 %u2013 %u2013 %u2013 %u2013Transfers and subsidies 113 039 296 649 278 389 149 993 206 028 224 340 131 354 151 920 158 756 (41.4)Provinces and municipalities %u2013 %u2013 %u2013 %u2013 %u2013 %u2013 %u2013 %u2013 %u2013Provinces %u2013 %u2013 %u2013 %u2013 %u2013 %u2013 %u2013 %u2013 %u2013Provincial Revenue Funds %u2013 %u2013 %u2013 %u2013 %u2013 %u2013 %u2013 %u2013 %u2013Provincial agencies and funds %u2013 %u2013 %u2013 %u2013 %u2013 %u2013 %u2013 %u2013 %u2013Municipalities %u2013 %u2013 %u2013 %u2013 %u2013 %u2013 %u2013 %u2013 %u2013Municipal bank accounts %u2013 %u2013 %u2013 %u2013 %u2013 %u2013 %u2013 %u2013 %u2013Municipal agencies and funds %u2013 %u2013 %u2013 %u2013 %u2013 %u2013 %u2013 %u2013 %u2013Departmental agencies and accounts %u2013 %u2013 %u2013 %u2013 %u2013 %u2013 %u2013 %u2013 %u2013Social security funds %u2013 %u2013 %u2013 %u2013 %u2013 %u2013 %u2013 %u2013 %u2013Departmental agencies (non-business entities) %u2013 %u2013 %u2013 %u2013 %u2013 %u2013 %u2013 %u2013 %u2013Higher education institutions %u2013 %u2013 %u2013 %u2013 %u2013 %u2013 %u2013 %u2013 %u2013Foreign governments and international organisations %u2013 %u2013 %u2013 %u2013 %u2013 %u2013 %u2013 %u2013 %u2013Public corporations and private enterprises %u2013 %u2013 %u2013 %u2013 %u2013 %u2013 %u2013 %u2013 %u2013Public corporations %u2013 %u2013 %u2013 %u2013 %u2013 %u2013 %u2013 %u2013 %u2013Subsidies on products and production (pc) %u2013 %u2013 %u2013 %u2013 %u2013 %u2013 %u2013 %u2013 %u2013Other transfers to public corporations %u2013 %u2013 %u2013 %u2013 %u2013 %u2013 %u2013 %u2013 %u2013Private enterprises %u2013 %u2013 %u2013 %u2013 %u2013 %u2013 %u2013 %u2013 %u2013Subsidies on products and production (pe) %u2013 %u2013 %u2013 %u2013 %u2013 %u2013 %u2013 %u2013 %u2013Other transfers to private enterprises %u2013 %u2013 %u2013 %u2013 %u2013 %u2013 %u2013 %u2013 %u2013Non-profit institutions %u2013 26 528 35 450 35 942 35 942 35 942 17 892 29 874 31 218 (50.2)Households 113 039 270 121 242 939 114 051 170 086 188 398 113 462 122 046 127 538 (39.8)Social benefits 88 435 53 516 69 185 44 105 51 500 58 497 46 084 47 053 49 170 (21.2)Other transfers to households 24 604 216 605 173 754 69 946 118 586 129 901 67 378 74 993 78 368 (48.1)Payments for capital assets 171 398 116 709 137 189 185 333 181 251 181 251 167 474 133 727 139 743 (7.6)Buildings and other fixed structures %u2013 %u2013 2 257 %u2013 %u2013 %u2013 %u2013 %u2013 %u2013Buildings %u2013 %u2013 2 257 %u2013 %u2013 %u2013 %u2013 %u2013 %u2013Other fixed structures %u2013 %u2013 %u2013 %u2013 %u2013 %u2013 %u2013 %u2013 %u2013Machinery and equipment 171 398 116 709 134 932 185 333 181 251 181 251 167 474 133 727 139 743 (7.6)Transport equipment 96 745 56 623 61 804 69 645 69 645 69 645 73 565 73 638 76 951 5.6Other machinery and equipment 74 653 60 086 73 128 115 688 111 606 111 606 93 909 60 089 62 792 (15.9)Heritage Assets %u2013 %u2013 %u2013 %u2013 %u2013 %u2013 %u2013 %u2013 %u2013Specialised military assets %u2013 %u2013 %u2013 %u2013 %u2013 %u2013 %u2013 %u2013 %u2013Biological assets %u2013 %u2013 %u2013 %u2013 %u2013 %u2013 %u2013 %u2013 %u2013Land and sub-soil assets %u2013 %u2013 %u2013 %u2013 %u2013 %u2013 %u2013 %u2013 %u2013Software and other intangible assets %u2013 %u2013 %u2013 %u2013 %u2013 %u2013 %u2013 %u2013 %u2013Payments for financial assets %u2013 %u2013 %u2013 %u2013 %u2013 %u2013 %u2013 %u2013 %u2013Total economic classification 15 094 877 15 077 221 15 618 193 15 568 004 15 660 045 15 739 260 15 773 326 16 666 348 17 350 499 0.22024/25202
