
Page 228 - Demo
P. 228
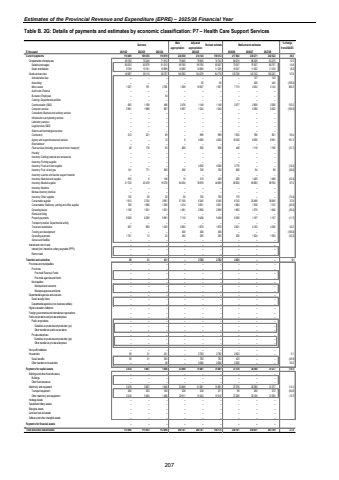
Estimates of the Provincial Revenue and Expenditure (EPRE) %u2013 2025/26 Financial YearTable B. 2G: Details of payments and estimates by economic classification: P7 %u2013 Health Care Support Services Outcome Main appropriationAdjusted appropriation Revised estimate Medium-term estimates % change from 2024/25R thousand 2021/22 2022/23 2023/24 2025/26 2026/27 2027/28Current payments 109 355 110 469 110 619 224 938 214 124 159 512 217 802 230 271 242 522 36.5Compensation of employees 69 782 70 240 71 912 79 845 79 845 74 742 84 074 86 529 92 275 12.5Salaries and wages 60 033 60 079 61 013 69 760 69 760 63 507 73 537 75 507 80 757 15.8Social contributions 9 749 10 161 10 899 10 085 10 085 11 235 10 537 11 022 11 518 (6.2)Goods and services 40 687 39 115 38 707 145 093 134 279 84 770 133 728 143 742 150 247 57.8Administrative fees %u2013 %u2013 %u2013 %u2013 %u2013 %u2013 %u2013 137 143 Advertising %u2013 %u2013 %u2013 %u2013 50 50 %u2013 426 445 (100.0)Minor assets 191 1 527 3 726 1 309 16 927 1 927 7 713 2 052 2 145 300.3Audit costs: External %u2013 %u2013 %u2013 %u2013 %u2013 %u2013 %u2013 %u2013 %u2013Bursaries: Employees %u2013 %u2013 34 %u2013 %u2013 %u2013 %u2013 %u2013 %u2013Catering: Departmental activities %u2013 %u2013 %u2013 %u2013 %u2013 %u2013 %u2013 %u2013 %u2013Communication (G&S) 955 1 168 496 2 478 1 148 1 148 2 677 2 800 2 926 133.2Computer services 2 901 1 998 867 5 097 1 242 1 242 %u2013 5 380 5 622 (100.0)Consultants: Business and advisory services %u2013 %u2013 %u2013 %u2013 %u2013 %u2013 %u2013 %u2013 %u2013Infrastructure and planning services %u2013 %u2013 %u2013 %u2013 %u2013 %u2013 %u2013 %u2013 %u2013Laboratory services %u2013 %u2013 %u2013 %u2013 %u2013 %u2013 %u2013 %u2013 %u2013Legal services (G&S) %u2013 %u2013 %u2013 %u2013 %u2013 %u2013 %u2013 %u2013 %u2013Science and technological services %u2013 %u2013 %u2013 %u2013 %u2013 %u2013 %u2013 %u2013 %u2013Contractors 212 221 69 %u2013 999 999 1 552 786 821 55.4Agency and support/outsourced services %u2013 %u2013 12 6 4 000 4 034 10 540 8 556 8 941 161.3Entertainment %u2013 %u2013 %u2013 %u2013 %u2013 %u2013 %u2013 %u2013 %u2013Fleet services (including government motor transport) 48 178 55 800 500 656 448 1 118 1 168 (31.7)Housing %u2013 %u2013 %u2013 %u2013 %u2013 %u2013 %u2013 %u2013 %u2013Inventory: Clothing material and accessories %u2013 %u2013 %u2013 %u2013 %u2013 %u2013 %u2013 %u2013 %u2013Inventory: Farming supplies %u2013 %u2013 %u2013 %u2013 %u2013 %u2013 %u2013 %u2013 %u2013Inventory: Food and food supplies %u2013 %u2013 %u2013 %u2013 4 500 4 500 3 770 %u2013 %u2013 (16.2)Inventory: Fuel, oil and gas 141 771 360 450 750 750 600 94 98 (20.0)Inventory: Learner and teacher support material %u2013 %u2013 %u2013 %u2013 %u2013 %u2013 %u2013 %u2013 %u2013Inventory: Materials and supplies 816 6 148 10 310 420 200 1 405 1 468 (52.4)Inventory: Medical supplies 21 722 22 478 19 276 84 034 78 878 44 069 82 620 85 863 89 764 87.5Inventory: Medicine %u2013 %u2013 %u2013 %u2013 %u2013 %u2013 %u2013 %u2013 %u2013Medsas inventory interface %u2013 %u2013 %u2013 %u2013 %u2013 %u2013 %u2013 %u2013 %u2013Inventory: Other supplies 132 59 20 50 700 700 179 %u2013 %u2013 (74.4)Consumable supplies 1 913 2 704 3 997 37 100 6 345 6 345 8 742 25 498 26 645 37.8Consumables: Stationery, printing and office supplies 706 1 096 1 360 1 414 3 051 3 051 1 664 1 258 1 315 (45.5)Operating leases 1 156 1 031 1 031 1 491 2 856 2 856 1 852 1 575 1 646 (35.2)Rental and hiring %u2013 %u2013 %u2013 %u2013 %u2013 %u2013 %u2013 %u2013 %u2013Property payments 6 050 6 309 5 991 7 110 9 458 9 458 8 350 1 107 1 157 (11.7)Transport provided: Departmental activity %u2013 %u2013 %u2013 %u2013 %u2013 %u2013 %u2013 %u2013 %u2013Travel and subsistence 657 892 1 243 2 852 1 870 1 870 2 621 4 163 4 350 40.2Training and development %u2013 %u2013 %u2013 400 400 400 %u2013 %u2013 %u2013 (100.0)Operating payments 1 751 13 22 492 295 295 200 1 524 1 593 (32.2)Venues and facilities %u2013 %u2013 %u2013 %u2013 %u2013 %u2013 %u2013 %u2013 %u2013Interest and rent on land %u2013 %u2013 %u2013 %u2013 %u2013 %u2013 %u2013 %u2013 %u2013Interest (Incl. interest on unitary payments (PPP)) %u2013 %u2013 %u2013 %u2013 %u2013 %u2013 %u2013 %u2013 %u2013Rent on land %u2013 %u2013 %u2013 %u2013 %u2013 %u2013 %u2013 %u2013 %u2013Transfers and subsidies 39 31 431 %u2013 2 782 2 782 2 923 %u2013 %u2013 5.1 Provinces and municipalities %u2013 %u2013 %u2013 %u2013 %u2013 %u2013 %u2013 %u2013 %u2013Provinces %u2013 %u2013 %u2013 %u2013 %u2013 %u2013 %u2013 %u2013 %u2013Provincial Revenue Funds %u2013 %u2013 %u2013 %u2013 %u2013 %u2013 %u2013 %u2013 %u2013Provincial agencies and funds %u2013 %u2013 %u2013 %u2013 %u2013 %u2013 %u2013 %u2013 %u2013Municipalities %u2013 %u2013 %u2013 %u2013 %u2013 %u2013 %u2013 %u2013 %u2013Municipal bank accounts %u2013 %u2013 %u2013 %u2013 %u2013 %u2013 %u2013 %u2013 %u2013Municipal agencies and funds %u2013 %u2013 %u2013 %u2013 %u2013 %u2013 %u2013 %u2013 %u2013Departmental agencies and accounts %u2013 %u2013 %u2013 %u2013 %u2013 %u2013 %u2013 %u2013 %u2013Social security funds %u2013 %u2013 %u2013 %u2013 %u2013 %u2013 %u2013 %u2013 %u2013Departmental agencies (non-business entities) %u2013 %u2013 %u2013 %u2013 %u2013 %u2013 %u2013 %u2013 %u2013Higher education institutions %u2013 %u2013 %u2013 %u2013 %u2013 %u2013 %u2013 %u2013 %u2013Foreign governments and international organisations %u2013 %u2013 %u2013 %u2013 %u2013 %u2013 %u2013 %u2013 %u2013Public corporations and private enterprises %u2013 %u2013 %u2013 %u2013 %u2013 %u2013 %u2013 %u2013 %u2013Public corporations %u2013 %u2013 %u2013 %u2013 %u2013 %u2013 %u2013 %u2013 %u2013Subsidies on products and production (pc) %u2013 %u2013 %u2013 %u2013 %u2013 %u2013 %u2013 %u2013 %u2013Other transfers to public corporations %u2013 %u2013 %u2013 %u2013 %u2013 %u2013 %u2013 %u2013 %u2013Private enterprises %u2013 %u2013 %u2013 %u2013 %u2013 %u2013 %u2013 %u2013 %u2013Subsidies on products and production (pe) %u2013 %u2013 %u2013 %u2013 %u2013 %u2013 %u2013 %u2013 %u2013Other transfers to private enterprises %u2013 %u2013 %u2013 %u2013 %u2013 %u2013 %u2013 %u2013 %u2013Non-profit institutions %u2013 %u2013 %u2013 %u2013 %u2013 %u2013 %u2013 %u2013 %u2013Households 39 31 431 %u2013 2 782 2 782 2 923 %u2013 %u2013 5.1Social benefits 39 31 393 %u2013 782 782 423 %u2013 %u2013 (45.9)Other transfers to households %u2013 %u2013 38 %u2013 2 000 2 000 2 500 %u2013 %u2013 25.0Payments for capital assets 2 478 5 667 1 646 23 849 31 881 31 881 27 376 20 360 21 277 (14.1)Buildings and other fixed structures %u2013 %u2013 %u2013 %u2013 %u2013 %u2013 %u2013 %u2013 %u2013Buildings %u2013 %u2013 %u2013 %u2013 %u2013 %u2013 %u2013 %u2013 %u2013Other fixed structures %u2013 %u2013 %u2013 %u2013 %u2013 %u2013 %u2013 %u2013 %u2013Machinery and equipment 2 478 5 667 1 646 23 849 31 881 31 881 27 376 20 360 21 277 (14.1)Transport equipment 260 203 160 238 238 271 96 260 272 (64.6)Other machinery and equipment 2 218 5 464 1 486 23 611 31 643 31 610 27 280 20 100 21 005 (13.7)Heritage Assets %u2013 %u2013 %u2013 %u2013 %u2013 %u2013 %u2013 %u2013 %u2013Specialised military assets %u2013 %u2013 %u2013 %u2013 %u2013 %u2013 %u2013 %u2013 %u2013Biological assets %u2013 %u2013 %u2013 %u2013 %u2013 %u2013 %u2013 %u2013 %u2013Land and sub-soil assets %u2013 %u2013 %u2013 %u2013 %u2013 %u2013 %u2013 %u2013 %u2013Software and other intangible assets %u2013 %u2013 %u2013 %u2013 %u2013 %u2013 %u2013 %u2013 %u2013Payments for financial assets %u2013 %u2013 %u2013 %u2013 %u2013 %u2013 %u2013 %u2013 %u2013Total economic classification 112 986 115 053 112 696 248 787 248 787 194 175 248 101 250 631 263 799 27.82024/25207
