
Page 226 - Demo
P. 226
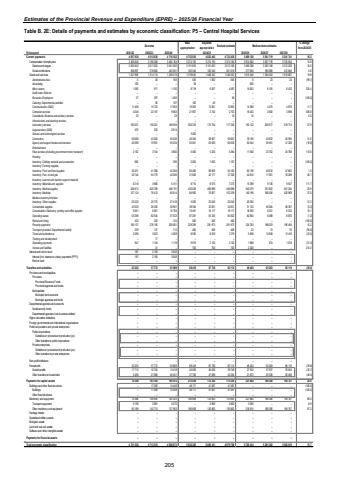
Estimates of the Provincial Revenue and Expenditure (EPRE) %u2013 2025/26 Financial YearTable B. 2E: Details of payments and estimates by economic classification: P5 %u2013 Central Hospital Services Outcome Main appropriationAdjusted appropriation Revised estimate Medium-term estimates % change from 2024/25R thousand 2021/22 2022/23 2023/24 2025/26 2026/27 2027/28Current payments 4 512 638 4 657 936 4 718 032 4 752 835 4 822 445 4 722 436 5 489 126 5 041 719 5 241 741 16.2Compensation of employees 3 409 840 3 196 308 3 465 164 3 374 193 3 374 193 3 374 184 3 874 082 3 657 176 3 725 054 14.8Salaries and wages 3 050 843 2 817 625 3 041 583 3 191 653 3 191 653 3 013 166 3 496 388 3 262 108 3 312 208 16.0Social contributions 358 997 378 683 423 581 182 540 182 540 361 018 377 694 395 068 412 846 4.6Goods and services 1 247 909 1 314 174 1 249 219 1 378 642 1 448 252 1 348 252 1 615 044 1 384 543 1 516 687 19.8Administrative fees 40 5 183 546 1 092 646 6 23 24 (99.1)Advertising %u2013 100 %u2013 58 %u2013 %u2013 600 %u2013 %u2013 Minor assets 971 1 583 1 192 8 718 6 597 4 487 14 602 6 155 6 432 225.4Audit costs: External %u2013 %u2013 %u2013 %u2013 %u2013 %u2013 %u2013 %u2013 %u2013Bursaries: Employees 27 397 1 483 %u2013 %u2013 58 %u2013 %u2013 %u2013 (100.0)Catering: Departmental activities %u2013 56 187 100 45 %u2013 %u2013 %u2013 %u2013Communication (G&S) 11 456 15 722 11 952 16 563 13 821 12 863 14 368 4 475 4 676 11.7Computer services 4 046 22 167 9 863 21 907 2 742 2 703 16 402 2 582 2 698 506.8Consultants: Business and advisory services 32 %u2013 23 %u2013 %u2013 10 10 %u2013 %u2013 0.0Infrastructure and planning services %u2013 %u2013 %u2013 %u2013 %u2013 %u2013 %u2013 %u2013 %u2013Laboratory services 182 631 130 201 148 594 206 233 175 764 117 340 150 132 209 077 218 774 27.9Legal services (G&S) 479 325 2 814 %u2013 %u2013 %u2013 %u2013 %u2013 %u2013Science and technological services %u2013 %u2013 %u2013 3 000 %u2013 %u2013 %u2013 %u2013 %u2013Contractors 50 668 43 520 45 526 46 364 59 667 59 667 78 156 43 632 45 595 31.0Agency and support/outsourced services 45 089 75 901 55 254 53 001 63 636 60 636 50 544 39 451 41 226 (16.6)Entertainment %u2013 %u2013 %u2013 %u2013 %u2013 %u2013 %u2013 %u2013 %u2013Fleet services (including government motor transport) 2 152 3 744 3 882 5 400 5 320 5 384 11 500 23 702 24 768 113.6Housing %u2013 %u2013 %u2013 %u2013 %u2013 %u2013 %u2013 %u2013 %u2013Inventory: Clothing material and accessories 665 %u2013 390 2 000 1 000 1 167 %u2013 %u2013 %u2013 (100.0)Inventory: Farming supplies %u2013 %u2013 %u2013 %u2013 %u2013 %u2013 %u2013 %u2013 %u2013Inventory: Food and food supplies 36 431 41 386 44 384 65 466 89 060 64 160 65 136 45 610 47 663 1.5Inventory: Fuel, oil and gas 30 744 54 779 42 006 31 682 42 177 37 326 44 810 17 501 18 289 20.1Inventory: Learner and teacher support material %u2013 %u2013 %u2013 %u2013 %u2013 %u2013 %u2013 %u2013 %u2013Inventory: Materials and supplies 6 218 4 980 6 101 8 715 8 575 7 275 15 398 9 136 9 547 111.7Inventory: Medical supplies 426 812 420 789 448 191 430 028 480 698 446 698 540 075 351 822 401 254 20.9Inventory: Medicine 127 124 76 413 85 814 84 900 76 607 102 339 140 196 368 436 420 968 37.0Medsas inventory interface %u2013 %u2013 %u2013 %u2013 %u2013 %u2013 %u2013 %u2013 %u2013Inventory: Other supplies 25 320 25 770 27 418 5 000 23 045 20 045 26 292 %u2013 %u2013 31.2Consumable supplies 43 025 26 430 30 961 38 394 32 831 32 831 31 132 46 284 48 367 (5.2)Consumables: Stationery, printing and office supplies 5 661 6 561 10 794 13 491 16 117 16 117 18 550 6 251 6 532 15.1Operating leases 53 296 82 545 57 523 87 281 55 320 63 622 62 854 8 488 8 870 (1.2)Rental and hiring 432 320 124 500 400 400 %u2013 %u2013 %u2013 (100.0)Property payments 190 137 276 195 209 061 229 289 281 973 281 973 324 783 188 033 196 494 15.2Transport provided: Departmental activity 239 137 112 460 406 406 22 73 76 (94.6)Travel and subsistence 2 590 3 623 4 269 8 930 8 539 7 279 5 608 12 838 13 416 (23.0)Training and development %u2013 17 %u2013 %u2013 %u2013 %u2013 %u2013 %u2013 %u2013Operating payments 947 1 144 1 118 9 916 2 120 2 120 1 668 974 1 018 (21.3)Venues and facilities %u2013 41 %u2013 700 700 700 2 200 %u2013 %u2013 214.3Interest and rent on land 187 2 156 3 649 %u2013 %u2013 %u2013 %u2013 %u2013 %u2013Interest (Incl. interest on unitary payments (PPP)) 187 2 156 3 649 %u2013 %u2013 %u2013 %u2013 %u2013 %u2013Rent on land %u2013 %u2013 %u2013 %u2013 %u2013 %u2013 %u2013 %u2013 %u2013Transfers and subsidies 23 202 37 772 53 869 68 418 87 736 82 112 49 424 63 263 66 110 (39.8)Provinces and municipalities %u2013 %u2013 %u2013 %u2013 %u2013 %u2013 %u2013 %u2013 %u2013Provinces %u2013 %u2013 %u2013 %u2013 %u2013 %u2013 %u2013 %u2013 %u2013Provincial Revenue Funds %u2013 %u2013 %u2013 %u2013 %u2013 %u2013 %u2013 %u2013 %u2013Provincial agencies and funds %u2013 %u2013 %u2013 %u2013 %u2013 %u2013 %u2013 %u2013 %u2013Municipalities %u2013 %u2013 %u2013 %u2013 %u2013 %u2013 %u2013 %u2013 %u2013Municipal bank accounts %u2013 %u2013 %u2013 %u2013 %u2013 %u2013 %u2013 %u2013 %u2013Municipal agencies and funds %u2013 %u2013 %u2013 %u2013 %u2013 %u2013 %u2013 %u2013 %u2013Departmental agencies and accounts %u2013 %u2013 %u2013 %u2013 %u2013 %u2013 %u2013 %u2013 %u2013Social security funds %u2013 %u2013 %u2013 %u2013 %u2013 %u2013 %u2013 %u2013 %u2013Departmental agencies (non-business entities) %u2013 %u2013 %u2013 %u2013 %u2013 %u2013 %u2013 %u2013 %u2013Higher education institutions %u2013 %u2013 %u2013 %u2013 %u2013 %u2013 %u2013 %u2013 %u2013Foreign governments and international organisations %u2013 %u2013 %u2013 %u2013 %u2013 %u2013 %u2013 %u2013 %u2013Public corporations and private enterprises %u2013 %u2013 %u2013 %u2013 %u2013 %u2013 %u2013 %u2013 %u2013Public corporations %u2013 %u2013 %u2013 %u2013 %u2013 %u2013 %u2013 %u2013 %u2013Subsidies on products and production (pc) %u2013 %u2013 %u2013 %u2013 %u2013 %u2013 %u2013 %u2013 %u2013Other transfers to public corporations %u2013 %u2013 %u2013 %u2013 %u2013 %u2013 %u2013 %u2013 %u2013Private enterprises %u2013 %u2013 %u2013 %u2013 %u2013 %u2013 %u2013 %u2013 %u2013Subsidies on products and production (pe) %u2013 %u2013 %u2013 %u2013 %u2013 %u2013 %u2013 %u2013 %u2013Other transfers to private enterprises %u2013 %u2013 %u2013 %u2013 %u2013 %u2013 %u2013 %u2013 %u2013Non-profit institutions %u2013 %u2013 %u2013 %u2013 %u2013 %u2013 %u2013 %u2013 %u2013Households 23 202 37 772 53 869 68 418 87 736 82 112 49 424 63 263 66 110 (39.8)Social benefits 17 712 10 704 13 418 40 638 40 638 39 748 27 552 37 937 39 644 (30.7)Other transfers to households 5 490 27 068 40 451 27 780 47 098 42 364 21 872 25 326 26 466 (48.4)Payments for capital assets 70 388 163 164 156 972 215 029 175 250 175 250 221 864 186 380 194 767 26.6Buildings and other fixed structures %u2013 17 509 14 449 48 171 41 587 41 587 %u2013 %u2013 %u2013 (100.0)Buildings %u2013 17 509 14 449 48 171 41 587 41 587 %u2013 %u2013 %u2013 (100.0)Other fixed structures %u2013 %u2013 %u2013 %u2013 %u2013 %u2013 %u2013 %u2013 %u2013Machinery and equipment 70 388 145 655 142 523 166 858 133 663 133 663 221 864 186 380 194 767 66.0Transport equipment 5 190 2 881 4 570 %u2013 2 800 2 800 3 050 %u2013 %u2013 8.9Other machinery and equipment 65 198 142 774 137 953 166 858 130 863 130 863 218 814 186 380 194 767 67.2Heritage Assets %u2013 %u2013 %u2013 %u2013 %u2013 %u2013 %u2013 %u2013 %u2013Specialised military assets %u2013 %u2013 %u2013 %u2013 %u2013 %u2013 %u2013 %u2013 %u2013Biological assets %u2013 %u2013 %u2013 %u2013 %u2013 %u2013 %u2013 %u2013 %u2013Land and sub-soil assets %u2013 %u2013 %u2013 %u2013 %u2013 %u2013 %u2013 %u2013 %u2013Software and other intangible assets %u2013 %u2013 %u2013 %u2013 %u2013 %u2013 %u2013 %u2013 %u2013Payments for financial assets %u2013 %u2013 %u2013 %u2013 %u2013 %u2013 %u2013 %u2013 %u2013Total economic classification 4 751 526 4 713 574 4 928 873 5 036 282 5 085 431 4 979 798 5 760 414 5 291 362 5 502 618 15.72024/25205
