
Page 227 - Demo
P. 227
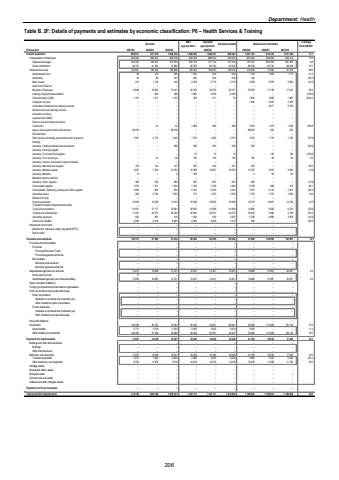
Department: HealthTable B. 2F: Details of payments and estimates by economic classification: P6 %u2013 Health Services & Training Outcome Main appropriationAdjusted appropriation Revised estimate Medium-term estimates % change from 2024/25R thousand 2021/22 2022/23 2023/24 2025/26 2026/27 2027/28Current payments 917 579 606 611 1 022 218 1 080 025 1 044 537 936 597 1 097 197 972 376 1 017 584 17.1Compensation of employees 483 560 809 225 829 418 930 502 888 502 780 562 881 942 894 694 936 374 13.0Salaries and wages 443 403 768 045 787 555 839 739 797 739 731 020 795 197 803 959 841 556 8.8Social contributions 40 157 41 180 41 863 90 763 90 763 49 542 86 745 90 735 94 818 75.1Goods and services 123 051 108 354 192 800 149 523 156 035 156 035 215 255 77 682 81 210 38.0Administrative fees 68 473 505 1 050 932 932 1 130 1 065 1 113 21.2Advertising 28 82 437 620 540 540 334 %u2013 %u2013 (38.1)Minor assets 415 1 153 142 4 763 3 719 3 719 3 320 2 578 2 693 (10.7)Audit costs: External %u2013 %u2013 %u2013 %u2013 %u2013 %u2013 %u2013 %u2013 %u2013Bursaries: Employees 14 640 13 822 13 441 32 766 30 709 30 721 38 785 17 138 17 947 26.2Catering: Departmental activities 7 690 308 1 860 2 259 2 259 %u2013 %u2013 %u2013 (100.0)Communication (G&S) 1 191 1 417 1 123 784 311 79 1 844 1 806 1 887 2234.2Computer services %u2013 %u2013 %u2013 %u2013 %u2013 %u2013 1 546 5 076 5 305Consultants: Business and advisory services %u2013 %u2013 %u2013 %u2013 %u2013 %u2013 %u2013 6 271 6 553Infrastructure and planning services %u2013 %u2013 %u2013 %u2013 %u2013 %u2013 %u2013 %u2013 %u2013Laboratory services %u2013 %u2013 %u2013 %u2013 %u2013 %u2013 %u2013 %u2013 %u2013Legal services (G&S) %u2013 %u2013 %u2013 %u2013 %u2013 %u2013 %u2013 %u2013 %u2013Science and technological services %u2013 %u2013 %u2013 %u2013 %u2013 %u2013 %u2013 %u2013 %u2013Contractors %u2013 23 52 1 068 480 480 2 322 1 473 1 539 383.8Agency and support/outsourced services 50 318 %u2013 80 218 %u2013 %u2013 %u2013 88 616 223 233Entertainment %u2013 %u2013 %u2013 %u2013 %u2013 %u2013 %u2013 %u2013 %u2013Fleet services (including government motor transport) 1 501 2 176 1 445 1 572 1 382 3 737 1 572 1 718 1 795 (57.9)Housing %u2013 %u2013 %u2013 %u2013 %u2013 %u2013 %u2013 %u2013 %u2013Inventory: Clothing material and accessories %u2013 %u2013 600 500 500 500 200 %u2013 %u2013 (60.0)Inventory: Farming supplies %u2013 %u2013 %u2013 %u2013 %u2013 %u2013 %u2013 %u2013 %u2013Inventory: Food and food supplies %u2013 %u2013 %u2013 10 10 10 %u2013 149 156 (100.0)Inventory: Fuel, oil and gas %u2013 23 30 150 150 150 150 58 60 0.0Inventory: Learner and teacher support material %u2013 %u2013 %u2013 %u2013 %u2013 %u2013 %u2013 %u2013 %u2013Inventory: Materials and supplies 102 144 147 550 440 441 610 %u2013 %u2013 38.3Inventory: Medical supplies 3 057 7 763 12 764 10 385 10 567 10 543 10 187 5 612 5 864 (3.4)Inventory: Medicine 13 %u2013 3 708 %u2013 %u2013 2 66 69Medsas inventory interface %u2013 %u2013 %u2013 %u2013 %u2013 %u2013 %u2013 %u2013 %u2013Inventory: Other supplies 383 278 285 565 687 687 565 %u2013 %u2013 (17.8)Consumable supplies 1 074 1 151 1 324 1 700 1 439 1 462 2 180 488 510 49.1Consumables: Stationery, printing and office supplies 1 852 699 834 5 470 2 343 2 343 1 871 4 118 4 303 (20.1)Operating leases 328 2 183 1 253 715 1 553 1 553 1 770 1 515 1 583 14.0Rental and hiring %u2013 %u2013 %u2013 %u2013 %u2013 %u2013 %u2013 %u2013 %u2013Property payments 12 954 12 528 11 813 10 038 18 625 16 490 16 374 14 091 14 724 (0.7)Transport provided: Departmental activity %u2013 %u2013 %u2013 %u2013 %u2013 %u2013 %u2013 %u2013 %u2013Travel and subsistence 21 031 37 177 33 681 29 555 31 808 31 808 14 965 6 000 6 270 (53.0)Training and development 11 231 23 072 25 324 39 200 43 072 43 072 23 643 3 568 3 728 (45.1)Operating payments 602 955 410 1 294 509 3 297 2 769 4 669 4 878 (16.0)Venues and facilities 2 256 2 545 6 661 4 200 4 000 1 212 500 %u2013 %u2013 (58.7)Interest and rent on land %u2013 %u2013 %u2013 %u2013 %u2013 %u2013 %u2013 %u2013 %u2013Interest (Incl. interest on unitary payments (PPP)) %u2013 %u2013 %u2013 %u2013 %u2013 %u2013 %u2013 %u2013 %u2013Rent on land %u2013 %u2013 %u2013 %u2013 %u2013 %u2013 %u2013 %u2013 %u2013Transfers and subsidies 156 311 57 589 41 812 66 840 60 328 60 362 67 886 139 695 145 981 12.5 Provinces and municipalities %u2013 %u2013 %u2013 %u2013 %u2013 %u2013 %u2013 %u2013 %u2013Provinces %u2013 %u2013 %u2013 %u2013 %u2013 %u2013 %u2013 %u2013 %u2013Provincial Revenue Funds %u2013 %u2013 %u2013 %u2013 %u2013 %u2013 %u2013 %u2013 %u2013Provincial agencies and funds %u2013 %u2013 %u2013 %u2013 %u2013 %u2013 %u2013 %u2013 %u2013Municipalities %u2013 %u2013 %u2013 %u2013 %u2013 %u2013 %u2013 %u2013 %u2013Municipal bank accounts %u2013 %u2013 %u2013 %u2013 %u2013 %u2013 %u2013 %u2013 %u2013Municipal agencies and funds %u2013 %u2013 %u2013 %u2013 %u2013 %u2013 %u2013 %u2013 %u2013Departmental agencies and accounts 13 075 16 866 14 721 14 401 14 401 14 401 14 886 21 867 22 851 3.4Social security funds 17 %u2013 %u2013 %u2013 %u2013 %u2013 %u2013 %u2013 %u2013Departmental agencies (non-business entities) 13 058 16 866 14 721 14 401 14 401 14 401 14 886 21 867 22 851 3.4Higher education institutions %u2013 %u2013 %u2013 %u2013 %u2013 %u2013 %u2013 %u2013 %u2013Foreign governments and international organisations %u2013 %u2013 %u2013 %u2013 %u2013 %u2013 %u2013 %u2013 %u2013Public corporations and private enterprises %u2013 %u2013 %u2013 %u2013 %u2013 %u2013 %u2013 %u2013 %u2013Public corporations %u2013 %u2013 %u2013 %u2013 %u2013 %u2013 %u2013 %u2013 %u2013Subsidies on products and production (pc) %u2013 %u2013 %u2013 %u2013 %u2013 %u2013 %u2013 %u2013 %u2013Other transfers to public corporations %u2013 %u2013 %u2013 %u2013 %u2013 %u2013 %u2013 %u2013 %u2013Private enterprises %u2013 %u2013 %u2013 %u2013 %u2013 %u2013 %u2013 %u2013 %u2013Subsidies on products and production (pe) %u2013 %u2013 %u2013 %u2013 %u2013 %u2013 %u2013 %u2013 %u2013Other transfers to private enterprises %u2013 %u2013 %u2013 %u2013 %u2013 %u2013 %u2013 %u2013 %u2013Non-profit institutions %u2013 %u2013 %u2013 %u2013 %u2013 %u2013 %u2013 %u2013 %u2013Households 143 236 40 723 27 091 52 439 45 927 45 961 53 000 117 828 123 130 15.3Social benefits 2 771 3 224 2 202 3 000 3 000 3 034 3 000 %u2013 %u2013 (1.1)Other transfers to households 140 465 37 499 24 889 49 439 42 927 42 927 50 000 117 828 123 130 16.5Payments for capital assets 11 837 10 538 12 541 18 246 18 246 18 246 21 760 16 542 17 285 19.3Buildings and other fixed structures %u2013 %u2013 %u2013 %u2013 %u2013 %u2013 %u2013 %u2013 %u2013Buildings %u2013 %u2013 %u2013 %u2013 %u2013 %u2013 %u2013 %u2013 %u2013Other fixed structures %u2013 %u2013 %u2013 %u2013 %u2013 %u2013 %u2013 %u2013 %u2013Machinery and equipment 11 837 10 538 12 541 18 246 18 246 18 246 21 760 16 542 17 285 19.3Transport equipment 3 073 1 460 8 622 3 628 3 628 3 628 2 682 5 254 5 490 (26.1)Other machinery and equipment 8 764 9 078 3 919 14 618 14 618 14 618 19 078 11 288 11 795 30.5Heritage Assets %u2013 %u2013 %u2013 %u2013 %u2013 %u2013 %u2013 %u2013 %u2013Specialised military assets %u2013 %u2013 %u2013 %u2013 %u2013 %u2013 %u2013 %u2013 %u2013Biological assets %u2013 %u2013 %u2013 %u2013 %u2013 %u2013 %u2013 %u2013 %u2013Land and sub-soil assets %u2013 %u2013 %u2013 %u2013 %u2013 %u2013 %u2013 %u2013 %u2013Software and other intangible assets %u2013 %u2013 %u2013 %u2013 %u2013 %u2013 %u2013 %u2013 %u2013Payments for financial assets %u2013 %u2013 %u2013 %u2013 %u2013 %u2013 %u2013 %u2013 %u2013Total economic classification 774 759 985 706 1 076 571 1 165 111 1 123 111 1 015 205 1 186 843 1 128 613 1 180 850 16.92024/25206
