
Page 230 - Demo
P. 230
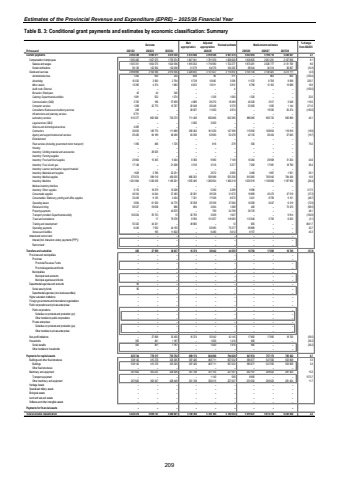
Estimates of the Provincial Revenue and Expenditure (EPRE) %u2013 2025/26 Financial YearTable B. 3: Conditional grant payments and estimates by economic classification: Summary Outcome Main appropriationAdjusted appropriation Revised estimate Medium-term estimates % change from 2024/25R thousand 2021/22 2022/23 2023/24 2025/26 2026/27 2027/28Current payments 5 090 671 4 594 349 4 670 530 5 074 846 4 918 586 4 941 470 5 043 955 5 199 716 5 440 947 2.1Compensation of employees 1 595 480 1 927 075 1 755 974 1 847 941 1 781 559 1 826 600 1 938 825 2 061 291 2 167 836 6.1Salaries and wages 1 505 351 1 804 575 1 623 936 1 816 362 1 716 980 1 722 277 1 870 281 2 026 777 2 131 769 8.6Social contributions 90 129 122 500 132 038 31 579 64 579 104 323 68 544 34 514 36 067 (34.3)Goods and services 2 998 869 3 163 596 2 914 556 3 226 905 3 137 027 3 114 870 3 105 130 3 138 425 3 273 111 (0.3)Administrative fees 1 200 930 254 608 80 311 %u2013 664 694 (100.0)Advertising 10 032 2 560 2 794 9 728 10 845 3 509 11 570 8 706 9 098 229.7Minor assets 12 395 4 374 1 683 8 203 13 611 5 813 6 796 13 100 13 688 16.9Audit costs: External %u2013 %u2013 %u2013 %u2013 %u2013 4 %u2013 %u2013 %u2013 (100.0)Bursaries: Employees 45 44 340 %u2013 %u2013 %u2013 %u2013 %u2013 %u2013Catering: Departmental activities 1 081 522 1 074 %u2013 1 326 1 082 1 320 %u2013 %u2013 22.0Communication (G&S) 3 700 186 57 659 4 689 29 270 18 369 40 326 2 917 3 048 119.5Computer services 1 298 22 775 10 767 20 048 20 048 9 370 53 500 1 095 1 144 471.0Consultants: Business and advisory services 248 %u2013 %u2013 28 927 11 000 2 874 %u2013 19 592 20 474 (100.0)Infrastructure and planning services 6 751 %u2013 %u2013 %u2013 %u2013 %u2013 %u2013 %u2013 %u2013Laboratory services 910 377 862 900 730 373 711 409 650 866 632 385 886 065 900 723 900 869 40.1Legal services (G&S) %u2013 %u2013 %u2013 3 000 3 000 %u2013 %u2013 %u2013 %u2013Science and technological services 4 483 %u2013 %u2013 %u2013 %u2013 %u2013 %u2013 %u2013 %u2013Contractors 30 833 128 770 111 669 290 462 161 029 147 399 119 592 108 654 119 816 (18.9)Agency and support/outsourced services 25 420 84 189 46 490 63 256 63 660 52 478 42 135 26 454 27 645 (19.7)Entertainment %u2013 %u2013 %u2013 %u2013 %u2013 %u2013 %u2013 %u2013 %u2013Fleet services (including government motor transport) 1 390 496 1 725 %u2013 816 279 500 %u2013 %u2013 79.2Housing %u2013 %u2013 %u2013 %u2013 %u2013 %u2013 %u2013 %u2013 %u2013Inventory: Clothing material and accessories %u2013 28 025 %u2013 %u2013 %u2013 %u2013 %u2013 %u2013 %u2013Inventory: Farming supplies %u2013 %u2013 %u2013 %u2013 %u2013 %u2013 %u2013 %u2013 %u2013Inventory: Food and food supplies 23 964 15 455 9 404 8 366 9 980 7 149 10 264 29 908 31 254 43.6Inventory: Fuel, oil and gas 17 146 %u2013 21 208 3 516 3 516 5 277 7 200 17 981 18 790 36.4Inventory: Learner and teacher support material %u2013 %u2013 %u2013 %u2013 %u2013 %u2013 %u2013 %u2013 %u2013Inventory: Materials and supplies 1 628 2 786 22 231 %u2013 2 672 2 695 3 480 1 867 1 951 29.1Inventory: Medical supplies 375 074 398 510 456 035 866 203 556 986 555 256 615 665 783 942 784 436 10.9Inventory: Medicine 1 261 864 1 336 635 1 185 201 1 055 485 1 260 804 1 366 219 1 005 919 1 156 800 1 187 956 (26.4)Medsas inventory interface %u2013 %u2013 %u2013 %u2013 %u2013 %u2013 %u2013 %u2013 %u2013Inventory: Other supplies 2 170 18 279 10 228 %u2013 5 290 2 299 9 598 %u2013 %u2013 317.5Consumable supplies 49 334 14 044 27 483 20 381 39 528 31 672 19 899 45 473 47 519 (37.2)Consumables: Stationery, printing and office supplies 32 439 9 135 3 454 7 321 17 938 6 672 3 421 8 709 9 101 (48.7)Operating leases 5 694 61 529 34 775 35 558 35 558 37 060 10 058 6 047 6 319 (72.9)Rental and hiring 56 527 59 636 666 694 2 064 1 268 400 %u2013 73 470 (68.5)Property payments %u2013 %u2013 43 675 %u2013 709 24 799 36 725 %u2013 %u2013 48.1Transport provided: Departmental activity 102 024 59 733 13 30 793 3 009 1 647 %u2013 %u2013 9 814 (100.0)Travel and subsistence %u2013 17 79 578 8 593 131 057 118 083 112 046 5 793 6 025 (5.1)Training and development 55 322 44 321 %u2013 49 665 %u2013 12 605 %u2013 %u2013 4941.7Operating payments 6 430 7 550 44 155 %u2013 92 885 75 277 99 889 %u2013 %u2013 32.7Venues and facilities %u2013 195 11 622 %u2013 9 480 5 612 8 157 %u2013 %u2013 45.3Interest and rent on land %u2013 %u2013 %u2013 %u2013 %u2013 %u2013 %u2013 %u2013 %u2013Interest (Incl. interest on unitary payments (PPP)) %u2013 %u2013 %u2013 %u2013 %u2013 %u2013 %u2013 %u2013 %u2013Rent on land %u2013 %u2013 %u2013 %u2013 %u2013 %u2013 %u2013 %u2013 %u2013Transfers and subsidies 385 27 559 36 637 16 374 36 942 44 555 18 792 17 895 18 700 (57.8)Provinces and municipalities %u2013 %u2013 %u2013 %u2013 %u2013 %u2013 %u2013 %u2013 %u2013Provinces %u2013 %u2013 %u2013 %u2013 %u2013 %u2013 %u2013 %u2013 %u2013Provincial Revenue Funds %u2013 %u2013 %u2013 %u2013 %u2013 %u2013 %u2013 %u2013 %u2013Provincial agencies and funds %u2013 %u2013 %u2013 %u2013 %u2013 %u2013 %u2013 %u2013 %u2013Municipalities %u2013 %u2013 %u2013 %u2013 %u2013 %u2013 %u2013 %u2013 %u2013Municipal bank accounts %u2013 %u2013 %u2013 %u2013 %u2013 %u2013 %u2013 %u2013 %u2013Municipal agencies and funds %u2013 %u2013 %u2013 %u2013 %u2013 %u2013 %u2013 %u2013 %u2013Departmental agencies and accounts 80 %u2013 %u2013 %u2013 %u2013 %u2013 %u2013 %u2013 %u2013Social security funds 80 %u2013 %u2013 %u2013 %u2013 %u2013 %u2013 %u2013 %u2013Departmental agencies (non-business entities) %u2013 %u2013 %u2013 %u2013 %u2013 %u2013 %u2013 %u2013 %u2013Higher education institutions %u2013 %u2013 %u2013 %u2013 %u2013 %u2013 %u2013 %u2013 %u2013Foreign governments and international organisations %u2013 %u2013 %u2013 %u2013 %u2013 %u2013 %u2013 %u2013 %u2013Public corporations and private enterprises %u2013 %u2013 %u2013 %u2013 %u2013 %u2013 %u2013 %u2013 %u2013Public corporations %u2013 %u2013 %u2013 %u2013 %u2013 %u2013 %u2013 %u2013 %u2013Subsidies on products and production (pc) %u2013 %u2013 %u2013 %u2013 %u2013 %u2013 %u2013 %u2013 %u2013Other transfers to public corporations %u2013 %u2013 %u2013 %u2013 %u2013 %u2013 %u2013 %u2013 %u2013Private enterprises %u2013 %u2013 %u2013 %u2013 %u2013 %u2013 %u2013 %u2013 %u2013Subsidies on products and production (pe) %u2013 %u2013 %u2013 %u2013 %u2013 %u2013 %u2013 %u2013 %u2013Other transfers to private enterprises %u2013 %u2013 %u2013 %u2013 %u2013 %u2013 %u2013 %u2013 %u2013Non-profit institutions %u2013 27 068 35 450 16 374 35 942 43 145 17 892 17 895 18 700 (58.5)Households 305 491 1 187 %u2013 1 000 1 410 900 %u2013 %u2013 (36.2)Social benefits 305 491 1 187 %u2013 1 000 1 410 900 %u2013 %u2013 (36.2)Other transfers to households %u2013 %u2013 %u2013 %u2013 %u2013 %u2013 %u2013 %u2013 %u2013Payments for capital assets 825 744 778 517 753 754 689 174 824 866 794 629 847 874 757 173 785 362 6.7Buildings and other fixed structures 538 142 415 270 325 305 387 426 493 711 567 032 585 677 547 550 503 908 3.3Buildings 538 142 415 270 325 305 387 426 493 711 567 032 585 677 547 550 503 908 3.3Other fixed structures %u2013 %u2013 %u2013 %u2013 %u2013 %u2013 %u2013 %u2013 %u2013Machinery and equipment 287 602 363 247 428 449 301 748 331 155 227 597 262 197 209 623 281 454 15.2Transport equipment %u2013 %u2013 %u2013 %u2013 1 140 590 8 695 %u2013 %u2013 1373.7Other machinery and equipment 287 602 363 247 428 449 301 748 330 015 227 007 253 502 209 623 281 454 11.7Heritage Assets %u2013 %u2013 %u2013 %u2013 %u2013 %u2013 %u2013 %u2013 %u2013Specialised military assets %u2013 %u2013 %u2013 %u2013 %u2013 %u2013 %u2013 %u2013 %u2013Biological assets %u2013 %u2013 %u2013 %u2013 %u2013 %u2013 %u2013 %u2013 %u2013Land and sub-soil assets %u2013 %u2013 %u2013 %u2013 %u2013 %u2013 %u2013 %u2013 %u2013Software and other intangible assets %u2013 %u2013 %u2013 %u2013 %u2013 %u2013 %u2013 %u2013 %u2013Payments for financial assets %u2013 %u2013 %u2013 %u2013 %u2013 %u2013 %u2013 %u2013 %u2013Total economic classification 5 420 478 5 896 747 5 460 921 5 780 394 5 780 394 5 780 654 5 910 621 5 974 784 6 245 008 2.22024/25209
