
Page 229 - Demo
P. 229
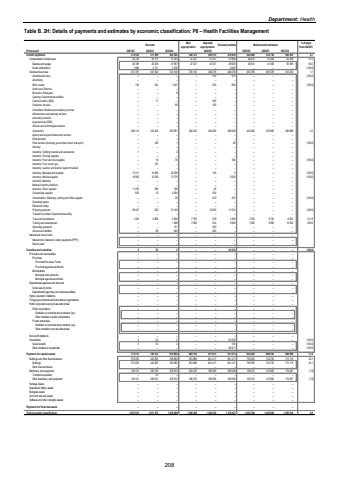
Department: HealthTable B. 2H: Details of payments and estimates by economic classification: P8 %u2013 Health Facilities Management Outcome Main appropriationAdjusted appropriation Revised estimate Medium-term estimates % change from 2024/25R thousand 2021/22 2022/23 2023/24 2025/26 2026/27 2027/28Current payments 371 209 374 535 403 392 426 372 495 515 479 938 502 408 535 136 560 832 4.7Compensation of employees 22 754 24 157 31 243 47 237 47 237 31 660 46 612 47 458 50 399 47.2Salaries and wages 20 768 22 026 27 967 47 237 47 237 28 605 46 612 47 458 50 399 63.0Social contributions 1 986 2 131 3 276 %u2013 %u2013 3 055 %u2013 %u2013 %u2013 (100.0)Goods and services 351 781 347 052 372 149 379 135 448 278 448 278 455 795 487 678 510 433 1.7Administrative fees %u2013 %u2013 %u2013 %u2013 750 473 %u2013 %u2013 %u2013 (100.0)Advertising %u2013 %u2013 %u2013 %u2013 %u2013 %u2013 %u2013 %u2013 %u2013Minor assets 132 334 1 347 %u2013 320 680 %u2013 %u2013 %u2013 (100.0)Audit costs: External %u2013 %u2013 %u2013 %u2013 %u2013 %u2013 %u2013 %u2013 %u2013Bursaries: Employees %u2013 %u2013 9 %u2013 %u2013 %u2013 %u2013 %u2013 %u2013Catering: Departmental activities %u2013 %u2013 %u2013 %u2013 %u2013 %u2013 %u2013 %u2013 %u2013Communication (G&S) %u2013 17 %u2013 %u2013 340 %u2013 %u2013 %u2013 %u2013Computer services %u2013 %u2013 99 %u2013 180 %u2013 %u2013 %u2013 %u2013Consultants: Business and advisory services %u2013 %u2013 %u2013 %u2013 %u2013 %u2013 %u2013 %u2013 %u2013Infrastructure and planning services %u2013 %u2013 %u2013 %u2013 %u2013 %u2013 %u2013 %u2013 %u2013Laboratory services %u2013 %u2013 %u2013 %u2013 %u2013 %u2013 %u2013 %u2013 %u2013Legal services (G&S) %u2013 %u2013 %u2013 %u2013 %u2013 %u2013 %u2013 %u2013 %u2013Science and technological services %u2013 %u2013 %u2013 %u2013 %u2013 %u2013 %u2013 %u2013 %u2013Contractors 266 114 310 426 287 691 364 342 434 266 428 938 443 002 476 885 490 888 3.3Agency and support/outsourced services %u2013 %u2013 %u2013 %u2013 %u2013 %u2013 %u2013 %u2013 %u2013Entertainment %u2013 %u2013 %u2013 %u2013 %u2013 %u2013 %u2013 %u2013 %u2013Fleet services (including government motor transport) %u2013 108 1 %u2013 %u2013 26 %u2013 %u2013 %u2013 (100.0)Housing %u2013 %u2013 %u2013 %u2013 %u2013 %u2013 %u2013 %u2013 %u2013Inventory: Clothing material and accessories 1 %u2013 2 %u2013 %u2013 %u2013 %u2013 %u2013 %u2013Inventory: Farming supplies %u2013 %u2013 %u2013 %u2013 %u2013 %u2013 %u2013 %u2013 %u2013Inventory: Food and food supplies %u2013 19 70 %u2013 %u2013 184 %u2013 %u2013 %u2013 (100.0)Inventory: Fuel, oil and gas %u2013 125 %u2013 %u2013 %u2013 %u2013 %u2013 %u2013 %u2013Inventory: Learner and teacher support material %u2013 %u2013 %u2013 %u2013 %u2013 %u2013 %u2013 %u2013 %u2013Inventory: Materials and supplies 17 411 19 909 42 528 %u2013 100 5 %u2013 %u2013 %u2013 (100.0)Inventory: Medical supplies 18 300 12 236 17 579 %u2013 %u2013 2 630 %u2013 %u2013 %u2013 (100.0)Inventory: Medicine %u2013 %u2013 %u2013 %u2013 %u2013 %u2013 %u2013 %u2013 %u2013Medsas inventory interface %u2013 %u2013 %u2013 %u2013 %u2013 %u2013 %u2013 %u2013 %u2013Inventory: Other supplies 11 250 596 190 %u2013 40 %u2013 %u2013 %u2013 %u2013Consumable supplies 833 12 4 564 %u2013 520 %u2013 %u2013 %u2013 %u2013Consumables: Stationery, printing and office supplies %u2013 %u2013 29 %u2013 410 410 %u2013 %u2013 %u2013 (100.0)Operating leases %u2013 %u2013 %u2013 %u2013 %u2013 %u2013 %u2013 %u2013 %u2013Rental and hiring %u2013 %u2013 %u2013 %u2013 %u2013 %u2013 %u2013 %u2013 %u2013Property payments 36 437 292 13 143 %u2013 10 000 11 074 %u2013 %u2013 %u2013 (100.0)Transport provided: Departmental activity %u2013 %u2013 %u2013 %u2013 %u2013 %u2013 %u2013 %u2013 %u2013Travel and subsistence 1 303 2 880 2 956 7 793 278 1 858 5 793 5 793 6 025 211.8Training and development %u2013 %u2013 1 408 7 000 324 2 000 7 000 5 000 13 520 250.0Operating payments %u2013 %u2013 131 %u2013 350 %u2013 %u2013 %u2013 %u2013Venues and facilities %u2013 98 402 %u2013 400 %u2013 %u2013 %u2013 %u2013Interest and rent on land %u2013 %u2013 %u2013 %u2013 %u2013 %u2013 %u2013 %u2013 %u2013Interest (Incl. interest on unitary payments (PPP)) %u2013 %u2013 %u2013 %u2013 %u2013 %u2013 %u2013 %u2013 %u2013Rent on land %u2013 %u2013 %u2013 %u2013 %u2013 %u2013 %u2013 %u2013 %u2013Transfers and subsidies 5 53 2 %u2013 %u2013 81 076 %u2013 %u2013 %u2013 (100.0)Provinces and municipalities %u2013 %u2013 %u2013 %u2013 %u2013 %u2013 %u2013 %u2013 %u2013Provinces %u2013 %u2013 %u2013 %u2013 %u2013 %u2013 %u2013 %u2013 %u2013Provincial Revenue Funds %u2013 %u2013 %u2013 %u2013 %u2013 %u2013 %u2013 %u2013 %u2013Provincial agencies and funds %u2013 %u2013 %u2013 %u2013 %u2013 %u2013 %u2013 %u2013 %u2013Municipalities %u2013 %u2013 %u2013 %u2013 %u2013 %u2013 %u2013 %u2013 %u2013Municipal bank accounts %u2013 %u2013 %u2013 %u2013 %u2013 %u2013 %u2013 %u2013 %u2013Municipal agencies and funds %u2013 %u2013 %u2013 %u2013 %u2013 %u2013 %u2013 %u2013 %u2013Departmental agencies and accounts %u2013 %u2013 %u2013 %u2013 %u2013 %u2013 %u2013 %u2013 %u2013Social security funds %u2013 %u2013 %u2013 %u2013 %u2013 %u2013 %u2013 %u2013 %u2013Departmental agencies (non-business entities) %u2013 %u2013 %u2013 %u2013 %u2013 %u2013 %u2013 %u2013 %u2013Higher education institutions %u2013 %u2013 %u2013 %u2013 %u2013 %u2013 %u2013 %u2013 %u2013Foreign governments and international organisations %u2013 %u2013 %u2013 %u2013 %u2013 %u2013 %u2013 %u2013 %u2013Public corporations and private enterprises %u2013 %u2013 %u2013 %u2013 %u2013 %u2013 %u2013 %u2013 %u2013Public corporations %u2013 %u2013 %u2013 %u2013 %u2013 %u2013 %u2013 %u2013 %u2013Subsidies on products and production (pc) %u2013 %u2013 %u2013 %u2013 %u2013 %u2013 %u2013 %u2013 %u2013Other transfers to public corporations %u2013 %u2013 %u2013 %u2013 %u2013 %u2013 %u2013 %u2013 %u2013Private enterprises %u2013 %u2013 %u2013 %u2013 %u2013 %u2013 %u2013 %u2013 %u2013Subsidies on products and production (pe) %u2013 %u2013 %u2013 %u2013 %u2013 %u2013 %u2013 %u2013 %u2013Other transfers to private enterprises %u2013 %u2013 %u2013 %u2013 %u2013 %u2013 %u2013 %u2013 %u2013Non-profit institutions %u2013 %u2013 %u2013 %u2013 %u2013 %u2013 %u2013 %u2013 %u2013Households 5 53 2 %u2013 %u2013 81 076 %u2013 %u2013 %u2013 (100.0)Social benefits 5 53 2 %u2013 %u2013 105 %u2013 %u2013 %u2013 (100.0)Other transfers to households %u2013 %u2013 %u2013 %u2013 %u2013 80 971 %u2013 %u2013 %u2013 (100.0)Payments for capital assets 713 373 700 313 614 694 880 156 811 013 811 013 952 299 890 530 889 686 17.4Buildings and other fixed structures 575 252 443 605 335 882 553 886 641 417 641 417 795 925 742 725 715 119 24.1Buildings 575 252 443 605 335 882 553 886 641 417 641 417 795 925 742 725 715 119 24.1Other fixed structures %u2013 %u2013 %u2013 %u2013 %u2013 %u2013 %u2013 %u2013 %u2013Machinery and equipment 138 121 256 708 278 812 326 270 169 596 169 596 156 373 147 805 174 567 (7.8)Transport equipment %u2013 35 %u2013 %u2013 %u2013 %u2013 %u2013 %u2013 %u2013Other machinery and equipment 138 121 256 673 278 812 326 270 169 596 169 596 156 373 147 805 174 567 (7.8)Heritage Assets %u2013 %u2013 %u2013 %u2013 %u2013 %u2013 %u2013 %u2013 %u2013Specialised military assets %u2013 %u2013 %u2013 %u2013 %u2013 %u2013 %u2013 %u2013 %u2013Biological assets %u2013 %u2013 %u2013 %u2013 %u2013 %u2013 %u2013 %u2013 %u2013Land and sub-soil assets %u2013 %u2013 %u2013 %u2013 %u2013 %u2013 %u2013 %u2013 %u2013Software and other intangible assets %u2013 %u2013 %u2013 %u2013 %u2013 %u2013 %u2013 %u2013 %u2013Payments for financial assets %u2013 %u2013 %u2013 %u2013 %u2013 %u2013 %u2013 %u2013 %u2013Total economic classification 1 087 913 1 071 575 1 018 088 1 306 528 1 306 528 1 372 027 1 454 706 1 425 666 1 450 518 6.02024/25208
