
Page 32 - Demo
P. 32
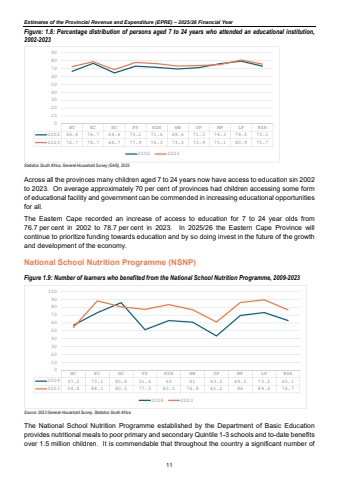
Estimates of the Provincial Revenue and Expenditure (EPRE) %u2013 2025/26 Financial YearFigure: 1.8: Percentage distribution of persons aged 7 to 24 years who attended an educational institution, 2002-2023 Statistics South Africa, General Household Survey (GHS), 2023Across all the provinces many children aged 7 to 24 years now have access to education sin 2002 to 2023. On average approximately 70 per cent of provinces had children accessing some form of educational facility and government can be commended in increasing educational opportunities for all. The Eastern Cape recorded an increase of access to education for 7 to 24 year olds from 76.7 per cent in 2002 to 78.7 per cent in 2023. In 2025/26 the Eastern Cape Province will continue to prioritize funding towards education and by so doing invest in the future of the growth and development of the economy. National School Nutrition Programme (NSNP) Figure 1.9: Number of learners who benefited from the National School Nutrition Programme, 2009-2023 Source: 2023 General Household Survey, Statistics South Africa The National School Nutrition Programme established by the Department of Basic Education provides nutritional meals to poor primary and secondary Quintile 1-3 schools and to-date benefits over 1.5 million children. It is commendable that throughout the country a significant number of WC EC NC FS KZN NW GP MP LP RSA2002 66.6 76.7 64.6 73.1 71.6 69.6 71.3 76.3 79.5 73.12023 72.7 78.7 68.7 77.9 76.3 73.3 73.9 75.1 80.9 75.701020304050607080902002 2023WC EC NC FS KZN NW GP MP LP RSA2009 57.2 73.1 85.8 51.4 63 61 43.5 69.5 73.2 63.12023 54.4 88.1 80.5 77.3 83.3 76.8 61.2 86 89.4 76.701020304050607080901002009 202311
