
Page 36 - Demo
P. 36
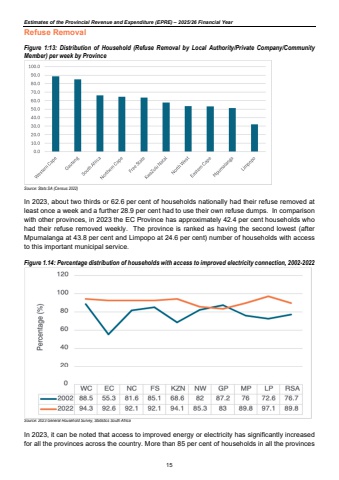
Estimates of the Provincial Revenue and Expenditure (EPRE) %u2013 2025/26 Financial YearRefuse Removal Figure 1:13: Distribution of Household (Refuse Removal by Local Authority/Private Company/Community Member) per week by Province Source: Stats SA (Census 2022)In 2023, about two thirds or 62.6 per cent of households nationally had their refuse removed at least once a week and a further 28.9 per cent had to use their own refuse dumps. In comparison with other provinces, in 2023 the EC Province has approximately 42.4 per cent households who had their refuse removed weekly. The province is ranked as having the second lowest (after Mpumalanga at 43.8 per cent and Limpopo at 24.6 per cent) number of households with access to this important municipal service. Figure 1.14: Percentage distribution of households with access to improved electricity connection, 2002-2022 Source: 2023 General Household Survey, Statistics South Africa In 2023, it can be noted that access to improved energy or electricity has significantly increased for all the provinces across the country. More than 85 per cent of households in all the provinces 15
