
Page 33 - Demo
P. 33
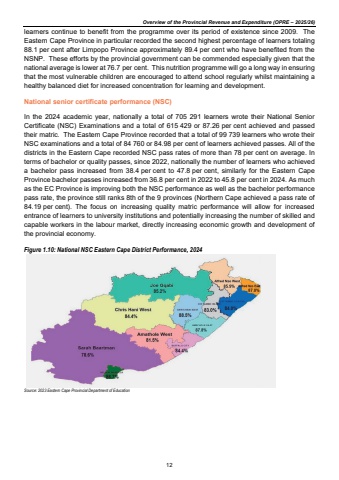
Overview of the Provincial Revenue and Expenditure (OPRE %u2013 2025/26)learners continue to benefit from the programme over its period of existence since 2009. The Eastern Cape Province in particular recorded the second highest percentage of learners totaling 88.1 per cent after Limpopo Province approximately 89.4 per cent who have benefited from the NSNP. These efforts by the provincial government can be commended especially given that the national average is lower at 76.7 per cent. This nutrition programme will go a long way in ensuring that the most vulnerable children are encouraged to attend school regularly whilst maintaining a healthy balanced diet for increased concentration for learning and development. National senior certificate performance (NSC) In the 2024 academic year, nationally a total of 705 291 learners wrote their National Senior Certificate (NSC) Examinations and a total of 615 429 or 87.26 per cent achieved and passed their matric. The Eastern Cape Province recorded that a total of 99 739 learners who wrote their NSC examinations and a total of 84 760 or 84.98 per cent of learners achieved passes. All of the districts in the Eastern Cape recorded NSC pass rates of more than 78 per cent on average. In terms of bachelor or quality passes, since 2022, nationally the number of learners who achieved a bachelor pass increased from 38.4 per cent to 47.8 per cent, similarly for the Eastern Cape Province bachelor passes increased from 36.8 per cent in 2022 to 45.8 per cent in 2024. As much as the EC Province is improving both the NSC performance as well as the bachelor performance pass rate, the province still ranks 8th of the 9 provinces (Northern Cape achieved a pass rate of 84.19 per cent). The focus on increasing quality matric performance will allow for increased entrance of learners to university institutions and potentially increasing the number of skilled and capable workers in the labour market, directly increasing economic growth and development of the provincial economy. Figure 1.10: National NSC Eastern Cape District Performance, 2024 Source: 2023 Eastern Cape Provincial Department of Education 12
