
Page 34 - Demo
P. 34
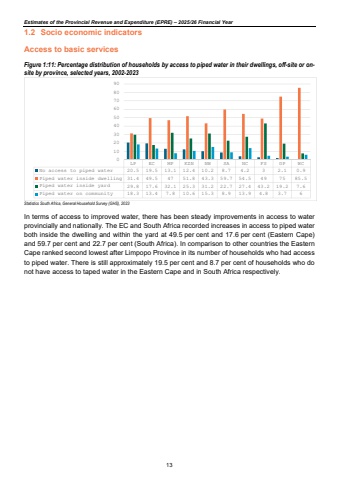
Estimates of the Provincial Revenue and Expenditure (EPRE) %u2013 2025/26 Financial Year1.2 Socio economic indicators Access to basic services Figure 1:11: Percentage distribution of households by access to piped water in their dwellings, off-site or onsite by province, selected years, 2002-2023 Statistics South Africa, General Household Survey (GHS), 2023 In terms of access to improved water, there has been steady improvements in access to water provincially and nationally. The EC and South Africa recorded increases in access to piped water both inside the dwelling and within the yard at 49.5 per cent and 17.6 per cent (Eastern Cape) and 59.7 per cent and 22.7 per cent (South Africa). In comparison to other countries the Eastern Cape ranked second lowest after Limpopo Province in its number of households who had access to piped water. There is still approximately 19.5 per cent and 8.7 per cent of households who do not have access to taped water in the Eastern Cape and in South Africa respectively. LP EC MP KZN NW SA NC FS GP WCNo access to piped water 20.5 19.5 13.1 12.4 10.2 8.7 4.2 3 2.1 0.9Piped water inside dwelling 31.4 49.5 47 51.8 43.3 59.7 54.5 49 75 85.5Piped water inside yard 29.8 17.6 32.1 25.3 31.2 22.7 27.4 43.2 19.2 7.6Piped water on community 18.3 13.4 7.8 10.6 15.3 8.9 13.9 4.8 3.7 6010203040506070809013
