
Page 38 - Demo
P. 38
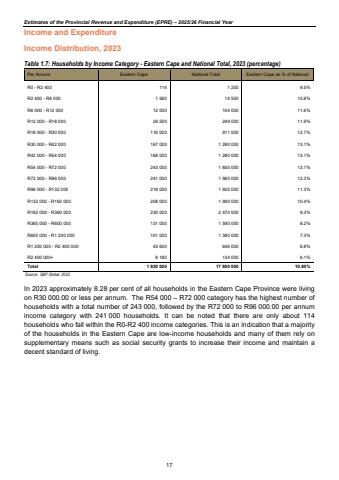
Estimates of the Provincial Revenue and Expenditure (EPRE) %u2013 2025/26 Financial YearIncome and Expenditure Income Distribution, 2023 Table 1.7: Households by Income Category - Eastern Cape and National Total, 2023 (percentage) Per Annum Eastern Cape National Total Eastern Cape as % of National R0 - R2 400 114 1 200 9.5% R2 400 - R6 000 1 560 14 500 10.8% R6 000 - R12 000 12 000 104 000 11.6% R12 000 - R18 000 29 500 249 000 11.9% R18 000 - R30 000 116 000 911 000 12.7% R30 000 - R42 000 167 000 1 280 000 13.1% R42 000 - R54 000 168 000 1 280 000 13.1% R54 000 - R72 000 243 000 1 850 000 13.1% R72 000 - R96 000 241 000 1 960 000 12.3% R96 000 - R132 000 218 000 1 920 000 11.3% R132 000 - R192 000 208 000 1 990 000 10.4% R192 000 - R360 000 230 000 2 470 000 9.3% R360 000 - R600 000 131 000 1 590 000 8.2% R600 000 - R1 200 000 101 000 1 380 000 7.3% R1 200 000 - R2 400 000 43 600 646 000 6.8% R2 400 000+ 8 180 134 000 6.1% Total 1 920 000 17 800 000 10.80% Source: S&P Global, 2023 In 2023 approximately 8.28 per cent of all households in the Eastern Cape Province were living on R30 000.00 or less per annum. The R54 000 %u2013 R72 000 category has the highest number of households with a total number of 243 000, followed by the R72 000 to R96 000.00 per annum income category with 241 000 households. It can be noted that there are only about 114 households who fall within the R0-R2 400 income categories. This is an indication that a majority of the households in the Eastern Cape are low-income households and many of them rely on supplementary means such as social security grants to increase their income and maintain a decent standard of living. 17
