
Page 376 - Demo
P. 376
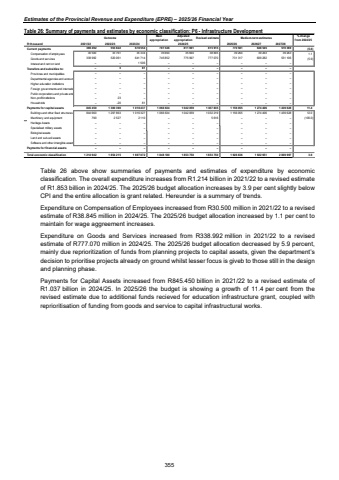
Estimates of the Provincial Revenue and Expenditure (EPRE) %u2013 2025/26 Financial YearTable 26: Summary of payments and estimates by economic classification: P6 - Infrastructure Development Outcome Main appropriationAdjusted appropriation Revised estimate Medium-term estimates % change from 2024/25R thousand 2021/22 2022/23 2023/24 2025/26 2026/27 2027/28Current payments 553 822 369 492 678 554 781 546 811 691 815 915 770 581 648 545 570 369 (5.6)Compensation of employees 33 761 30 500 35 334 35 694 35 694 38 845 39 264 39 263 39 263 1.1Goods and services 520 061 338 992 641 714 745 852 775 997 777 070 731 317 609 282 531 106 (5.9)Interest and rent on land %u2013 %u2013 1 506 %u2013 %u2013 %u2013 %u2013 %u2013 %u2013Transfers and subsidies to: %u2013 3 81 %u2013 %u2013 %u2013 %u2013 %u2013 %u2013Provinces and municipalities %u2013 %u2013 %u2013 %u2013 %u2013 %u2013 %u2013 %u2013 %u2013Departmental agencies and account %u2013 %u2013 %u2013 %u2013 %u2013 %u2013 %u2013 %u2013 %u2013Higher education institutions %u2013 %u2013 %u2013 %u2013 %u2013 %u2013 %u2013 %u2013 %u2013Foreign governments and internatio %u2013 %u2013 %u2013 %u2013 %u2013 %u2013 %u2013 %u2013 %u2013Public corporations and private ente %u2013 %u2013 %u2013 %u2013 %u2013 %u2013 %u2013 %u2013 %u2013Non-profit institutions %u2013 23 %u2013 %u2013 %u2013 %u2013 %u2013 %u2013 %u2013Households %u2013 -20 81 %u2013 %u2013 %u2013 %u2013 %u2013 %u2013Payments for capital assets 845 450 1 300 390 1 018 437 1 066 634 1 042 059 1 037 835 1 156 055 1 274 406 1 439 628 11.4Buildings and other fixed structures 844 660 1 297 863 1 016 327 1 066 634 1 042 059 1 032 219 1 156 055 1 274 406 1 439 628 12.0Machinery and equipment 790 2 527 2 110 %u2013 %u2013 5 616 %u2013 %u2013 %u2013 (100.0)Heritage Assets %u2013 %u2013 %u2013 %u2013 %u2013 %u2013 %u2013 %u2013 %u2013Specialised military assets %u2013 %u2013 %u2013 %u2013 %u2013 %u2013 %u2013 %u2013 %u2013Biological assets %u2013 %u2013 %u2013 %u2013 %u2013 %u2013 %u2013 %u2013 %u2013Land and sub-soil assets %u2013 %u2013 %u2013 %u2013 %u2013 %u2013 %u2013 %u2013 %u2013Software and other intangible assets %u2013 %u2013 %u2013 %u2013 %u2013 %u2013 %u2013 %u2013 %u2013Payments for financial assets %u2013 %u2013 %u2013 %u2013 %u2013 %u2013 %u2013 %u2013 %u2013Total economic classification 1 214 942 1 854 215 1 697 072 1 848 180 1 853 750 1 853 750 1 926 636 1 922 951 2 009 997 3.92024/25 Table 26 above show summaries of payments and estimates of expenditure by economic classification. The overall expenditure increases from R1.214 billion in 2021/22 to a revised estimate of R1.853 billion in 2024/25. The 2025/26 budget allocation increases by 3.9 per cent slightly below CPI and the entire allocation is grant related. Hereunder is a summary of trends. Expenditure on Compensation of Employees increased from R30.500 million in 2021/22 to a revised estimate of R38.845 million in 2024/25. The 2025/26 budget allocation increased by 1.1 per cent to maintain for wage aggreement increases. Expenditure on Goods and Services increased from R338.992 million in 2021/22 to a revised estimate of R777.070 million in 2024/25. The 2025/26 budget allocation decreased by 5.9 percent, mainly due reprioritization of funds from planning projects to capital assets, given the department%u2019s decision to prioritise projects already on ground whilst lesser focus is giveb to those still in the design and planning phase. Payments for Capital Assets increased from R845.450 billion in 2021/22 to a revised estimate of R1.037 billion in 2024/25. In 2025/26 the budget is showing a growth of 11.4 per cent from the revised estimate due to additional funds recieved for education infrastructure grant, coupled with reprioritisation of funding from goods and service to capital infrastructural works. 355
