
Page 477 - Provincial Treasury Estimates.pdf
P. 477
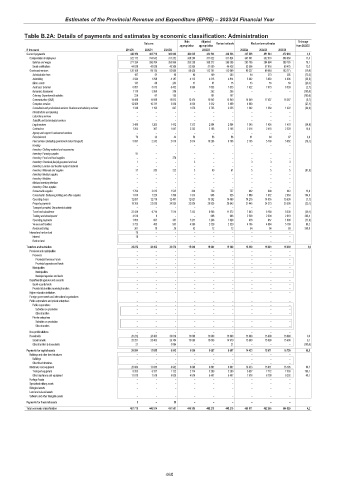
Estimates of the Provincial Revenue and Expenditure (EPRE) – 2023/24 Financial Year
Table B.2A: Details of payments and estimates by economic classification: Administration
Main Adjusted % change
Outcome Revised estimate Medium-term estimates
appropriation appropriation from 2022/23
R thousand 2019/20 2020/21 2021/22 2022/23 2023/24 2024/25 2025/26
Current payments 442 358 403 716 393 902 424 625 424 523 424 523 437 538 451 594 472 431 3,1
Compensation of employees 322 172 314 542 311 252 338 200 311 822 311 824 347 301 352 510 368 660 11,4
Salaries and wages 277 334 268 704 265 866 285 250 260 272 265 396 293 795 294 694 308 185 10,7
Social contributions 44 838 45 838 45 386 52 950 51 550 46 428 53 506 57 816 60 475 15,2
Goods and services 120 168 89 174 82 650 86 425 112 701 112 699 90 237 99 084 103 771 (19,9)
Administrative fees 167 51 98 90 189 383 94 273 285 (75,5)
Advertising 3 934 1 298 4 187 4 112 4 215 4 814 3 662 3 830 4 006 (23,9)
Minor assets 141 89 283 51 81 75 53 55 59 (29,3)
Audit cost: External 6 857 5 013 6 452 6 960 7 833 7 833 7 622 7 973 8 339 (2,7)
Bursaries: Employees 1 179 3 959 288 – 262 286 – – – (100,0)
Catering: Departmental activities 229 61 155 – 191 197 – – – (100,0)
Communication (G&S) 14 488 14 989 10 812 13 474 15 942 15 940 14 549 17 437 18 367 (8,7)
Computer services 12 569 10 311 5 858 4 834 5 512 5 489 4 000 – – (27,1)
Consultants and professional services: Business and advisory services 1 348 1 193 667 1 076 2 735 3 255 1 302 1 360 1 422 (60,0)
Infrastructure and planning – – – – – – – – –
Laboratory services – – – – – – – – –
Scientific and technological services – – – – – – – – –
Legal services 3 498 1 205 1 412 1 373 2 984 2 984 1 345 1 405 1 470 (54,9)
Contractors 1 203 367 1 047 2 232 2 106 2 106 2 316 2 418 2 529 10,0
Agency and support / outsourced services – – – – – – – – –
Entertainment 70 33 44 58 56 56 61 64 67 8,9
Fleet services (including government motor transport) 5 897 2 242 2 019 2 014 10 296 8 796 2 105 5 700 5 962 (76,1)
Housing – – – – – – – – –
Inventory: Clothing material and accessories – – – – – – – – –
Inventory: Farming supplies 91 – – – – – – – –
Inventory: Food and food supplies – – 376 – – – – – –
Inventory: Chemicals,fuel,oil,gas,wood and coal 1 – – 3 – – 3 3 3
Inventory: Learner and teacher support material – – – – – – – – –
Inventory: Materials and supplies 37 283 222 5 60 61 5 5 5 (91,8)
Inventory: Medical supplies – – – – – – – – –
Inventory: Medicine – – – – – – – – –
Medsas inventory interface – – – – – – – – –
Inventory: Other supplies – – – – – – – – –
Consumable supplies 1 704 3 015 1 525 426 759 757 862 900 942 13,9
Consumable: Stationery,printing and office supplies 1 910 1 220 1 399 1 313 908 926 1 889 1 972 2 063 104,0
Operating leases 12 851 12 779 12 447 12 627 15 382 14 468 14 215 14 855 15 539 (1,7)
Property payments 19 360 23 039 24 935 22 826 29 926 28 643 21 445 24 273 25 390 (25,1)
Transport provided: Departmental activity – – – – – – – – –
Travel and subsistence 22 439 6 714 7 514 7 322 8 986 11 572 7 043 8 160 8 536 (39,1)
Training and development 4 516 8 – – 688 688 2 500 2 504 2 619 263,4
Operating payments 1 655 801 381 1 277 1 249 1 029 916 957 1 000 (11,0)
Venues and facilities 3 723 485 503 4 300 2 329 2 329 4 196 4 884 5 109 80,2
Rental and hiring 301 19 26 52 12 12 54 56 59 350,0
Interest and rent on land 18 – – – – – – – –
Interest 18 – – – – – – – –
Rent on land – – – – – – – – –
Transfers and subsidies 25 272 28 403 30 678 15 000 15 000 15 000 15 000 15 000 15 690 0,0
Provinces and municipalities – – – – – – – – –
Provinces – – – – – – – – –
Provincial Revenue Funds – – – – – – – – –
Provincial agencies and funds – – – – – – – – –
Municipalities – – – – – – – – –
Municipalities – – – – – – – – –
Municipal agencies and funds – – – – – – – – –
Departmental agencies and accounts – – – – – – – – –
Social security funds – – – – – – – – –
Provide list of entities receiving transfers – – – – – – – – –
Higher education institutions – – – – – – – – –
Foreign governments and international organisations – – – – – – – – –
Public corporations and private enterprises – – – – – – – – –
Public corporations – – – – – – – – –
Subsidies on production – – – – – – – – –
Other transfers – – – – – – – – –
Private enterprises – – – – – – – – –
Subsidies on production – – – – – – – – –
Other transfers – – – – – – – – –
Non-profit institutions – – – – – – – – –
Households 25 272 28 403 30 678 15 000 15 000 15 000 15 000 15 000 15 690 0,0
Social benefits 25 251 28 403 26 784 15 000 15 000 14 979 15 000 15 000 15 690 0,1
Other transfers to households 21 – 3 894 – – 21 – – – (100,0)
Payments for capital assets 20 084 13 855 6 942 6 690 8 687 8 687 14 433 15 971 16 705 66,1
Buildings and other fixed structures – – – – – – – – –
Buildings – – – – – – – – –
Other fixed structures – – – – – – – – –
Machinery and equipment 20 084 13 855 6 942 6 690 8 687 8 687 14 433 15 971 16 705 66,1
Transport equipment 8 205 6 337 1 122 2 114 3 280 3 280 6 857 7 172 7 503 109,1
Other machinery and equipment 11 879 7 518 5 820 4 576 5 407 5 407 7 576 8 799 9 202 40,1
Heritage Assets – – – – – – – – –
Specialised military assets – – – – – – – – –
Biological assets – – – – – – – – –
Land and sub-soil assets – – – – – – – – –
Software and other intangible assets – – – – – – – – –
Payments for financial assets 5 – 59 – – – – – –
Total economic classification 487 719 445 974 431 581 446 315 448 210 448 210 466 971 482 565 504 826 4,2
460