
Page 597 - Provincial Treasury Estimates.pdf
P. 597
Estimates of the Provincial Revenue and Expenditure (EPRE) – 2023/24 Financial Year
7. Payment summary
7.1. Key assumptions
The following assumptions were taken into consideration when the budget was formulated:
x The department has made provision for pay progression at 1.5 per cent.
x The revised projections for Consumer Price Index (CPI) inflation utilised for the determination of
baselines over the 2023 MTEF are 4.42 per cent in 2023/24, 4.45 per cent in 2024/25 and
4.48 per cent in 2025/26;
x 2023 MTEF Baseline adjustments were effected as follows:
o An addition of R8.891 million in 2023/24; R8.984 million in 2024/25 and R9.116 million in
2025/26 for the cost of living adjustments;
o Adjustments to baseline relating to data in the PES formula resulted to an additional amount
of R1.154 million, R2.061 million and R2.016 million in 2023/24, 2024/25 and 2025/26
respectively; and
o Microsoft licenses function shift from the department to the Office of the Premier amounting to
R5.330 million in 2023/24; R5.570 million in 2024/25 and R5.821 million in 2025/26.
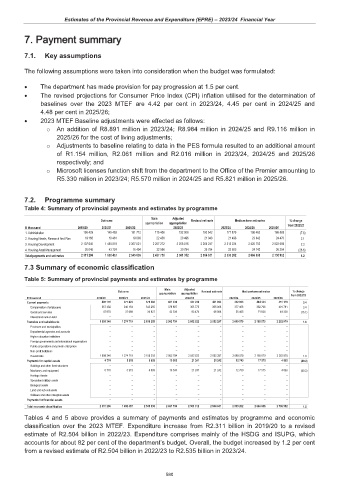
7.2. Programme summary
Table 4: Summary of provincial payments and estimates by programme
Main Adjusted
Outcome Revised estimate Medium-term estimates % change
appropriation appropriation
R thousand 2019/20 2020/21 2021/22 2022/23 2023/24 2024/25 2025/26 from 2022/23
1. Administration 158 429 145 453 151 712 175 406 192 006 192 542 177 875 198 462 165 569 (7.6)
2. Housing Needs, Research And Plan 19 166 18 461 19 808 22 456 20 496 21 048 21 498 23 042 24 470 2.1
3. Housing Development 2 107 645 1 450 819 2 357 021 2 207 272 2 258 016 2 260 247 2 313 224 2 420 752 2 522 659 2.3
4. Housing Asset Management 26 046 43 724 16 494 32 596 30 794 30 794 22 605 24 742 26 254 (26.6)
Total payments and estimates 2 311 286 1 658 457 2 545 035 2 437 730 2 501 312 2 504 631 2 535 202 2 666 998 2 738 952 1.2
7.3 Summary of economic classification
Table 5: Summary of provincial payments and estimates by programme
Main Adjusted
Outcome Revised estimate Medium-term estimates % change
appropriation appropriation from 2022/23
R thousand 2019/20 2020/21 2021/22 2022/23 2023/24 2024/25 2025/26
Current payments 405 170 377 823 379 882 421 436 427 249 431 093 432 923 464 344 451 119 0.4
Compensation of employees 357 492 340 154 343 255 378 897 363 775 365 006 377 458 392 706 401 781 3.4
Goods and services 47 678 37 669 36 627 42 539 63 474 66 086 55 465 71 638 49 338 (16.1)
Interest and rent on land – – – – – – – – –
Transfers and subsidies to: 1 899 346 1 274 719 2 158 255 2 002 794 2 052 822 2 052 297 2 089 579 2 185 079 2 282 970 1.8
Provinces and municipalities – – – – – – – – –
Departmental agencies and accounts – – – – – – – – –
Higher education institutions – – – – – – – – –
Foreign governments and international organisations – – – – – – – – –
Public corporations and private enterprises – – – – – – – – –
Non-profit institutions – – – – – – – – –
Households 1 899 346 1 274 719 2 158 255 2 002 794 2 052 822 2 052 297 2 089 579 2 185 079 2 282 970 1.8
Payments for capital assets 6 770 5 915 6 899 13 500 21 241 21 242 12 700 17 575 4 863 (40.2)
Buildings and other fixed structures – – – – – – – – –
Machinery and equipment 6 770 5 915 6 899 13 500 21 241 21 242 12 700 17 575 4 863 (40.2)
Heritage Assets – – – – – – – – –
Specialised military assets – – – – – – – – –
Biological assets – – – – – – – – –
Land and sub-soil assets – – – – – – – – –
Software and other intangible assets – – – – – – – – –
Payments for financial assets – – – – – – – – –
Total economic classification 2 311 286 1 658 457 2 545 035 2 437 730 2 501 312 2 504 631 2 535 202 2 666 998 2 738 952 1.2
Tables 4 and 5 above provides a summary of payments and estimates by programme and economic
classification over the 2023 MTEF. Expenditure increase from R2.311 billion in 2019/20 to a revised
estimate of R2.504 billion in 2022/23. Expenditure comprises mainly of the HSDG and ISUPG, which
accounts for about 82 per cent of the department’s budget. Overall, the budget increased by 1.2 per cent
from a revised estimate of R2.504 billion in 2022/23 to R2.535 billion in 2023/24.
580