
Page 598 - Provincial Treasury Estimates.pdf
P. 598
Department: +XPDQ 6HWWOHPHQWV
Compensation of Employees increases by 3.4 per cent in 2023/24 which caters for improved cost of
service where the budget increases from R365.006 million to R377.458 million due to additional funding
allocated for the cost of living adjustments in the 2023 MTEF period.
Goods and services decrease by 16.1 per cent from a revised estimate of R66.086 million in 2022/23 to
R55.465 million in 2023/24. Goods and services are driven by contractual obligations, an EPWP grant to
strengthen the existing empowerment specifically for youth, women and people with disabilities and
expenses related to the monitoring the running projects of the departments.
The main cost driver of the department’s budget is the transfers and subsidies that increased by
1.8 per cent from a revised estimate of R2.052 billion in 2022/23 to R2.089 billion in 2023/24 financial year.
This cost driver is mainly driven through the core business of the department.
Payments for Capital Assets decrease by 40.2 per cent from a revised estimate of R21.242 million in
2022/23 to R12.700 million in 2023/24 due to a roll-over allocated in the 2022/23 financial year for a
commitment from the previous year. CAPEX is driven by contractual obligations for fleet rentals, cell phone
rentals and the upgrading of ICT infrastructure.
7.4 Expenditure by municipal boundary
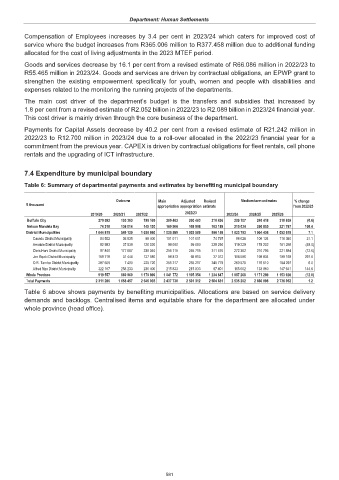
Table 6: Summary of departmental payments and estimates by benefiting municipal boundary
Outcome Main Adjusted Revised Medium-term estimates % change
R thousand appropriation appropriation estimate from 2022/23
2019/20 2020/21 2021/22 2022/23 2023/24 2024/25 2025/26
Buffalo City 270 592 103 363 198 165 200 463 200 463 210 436 209 107 240 418 310 639 (0.6)
Nelson Mandela Bay 76 318 136 014 145 120 169 906 169 906 103 189 215 034 250 855 221 767 108.4
District Municipalities 1 044 819 549 120 1 030 860 1 025 589 1 025 589 956 159 1 023 793 1 004 436 1 052 618 7.1
Cacadu District Municipality 84 502 36 835 88 400 101 011 101 011 74 797 98 026 106 134 118 360 31.1
Amatole District Municipality 92 983 37 539 120 020 99 000 99 000 229 294 119 229 178 202 181 268 (48.0)
Chris Hani District Municipality 97 840 177 667 238 340 255 715 255 715 311 576 272 362 210 796 221 884 (12.6)
Joe Gqabi District Municipality 159 718 31 446 127 980 98 813 98 813 27 312 108 596 198 834 199 168 297.6
O.R. Tambo District Municipality 287 609 7 400 225 720 255 217 255 217 245 779 260 578 176 510 184 297 6.0
Alfred Nzo District Municipality 322 167 258 233 230 400 215 833 215 833 67 401 165 002 133 960 147 641 144.8
Whole Province 919 557 869 960 1 170 890 1 041 772 1 105 354 1 234 847 1 087 268 1 171 289 1 153 928 (12.0)
Total Payments 2 311 286 1 658 457 2 545 035 2 437 730 2 501 312 2 504 631 2 535 202 2 666 998 2 738 952 1.2
Table 6 above shows payments by benefiting municipalities. Allocations are based on service delivery
demands and backlogs. Centralised items and equitable share for the department are allocated under
whole province (head office).
581